Evaluating Learning of Motion Graphs with a LiDAR-Based Smartphone Application
Publication
Metrics
AI Quick Summary
This paper introduces a free smartphone app using LiDAR data to enhance motion-based physics learning, particularly in graphing and mathematical modeling. Students using the LiDAR Motion app showed significantly better learning outcomes compared to those using standard sonic rangers, indicating its potential to improve classroom and home learning experiences.
Paper Preview
Abstract
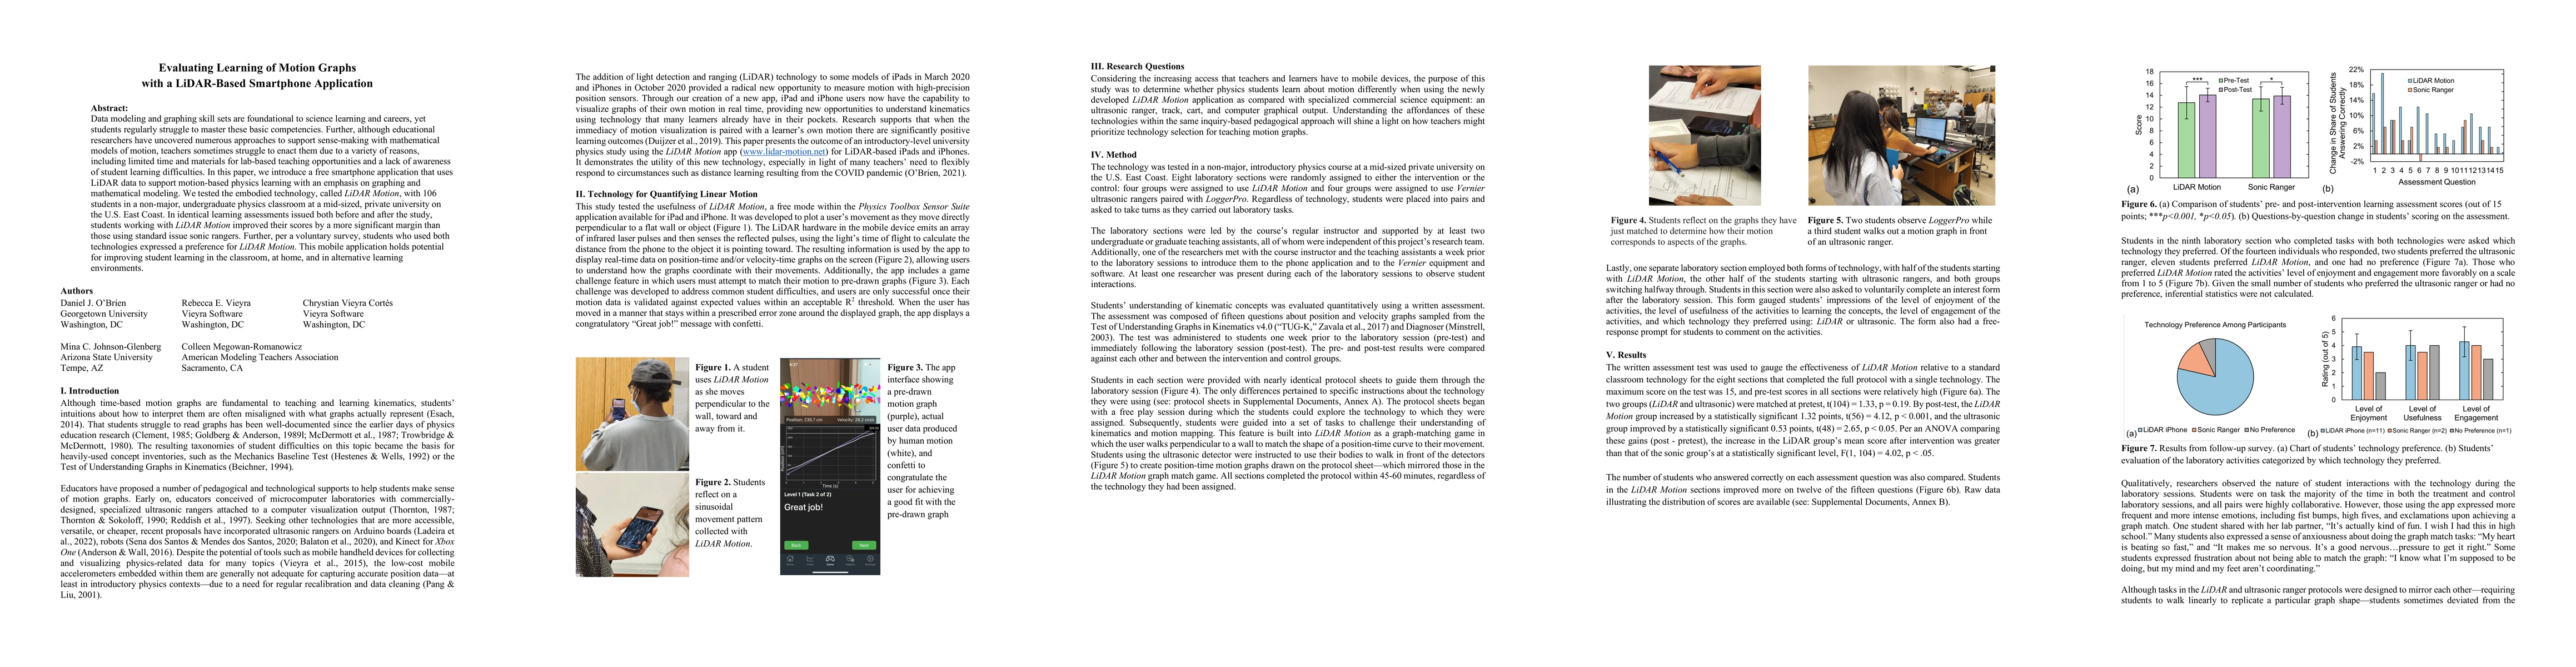
Data modeling and graphing skill sets are foundational to science learning and careers, yet students regularly struggle to master these basic competencies. Further, although educational researchers have uncovered numerous approaches to support sense-making with mathematical models of motion, teachers sometimes struggle to enact them due to a variety of reasons, including limited time and materials for lab-based teaching opportunities and a lack of awareness of student learning difficulties. In this paper, we introduce a free smartphone application that uses LiDAR data to support motion-based physics learning with an emphasis on graphing and mathematical modeling. We tested the embodied technology, called LiDAR Motion, with 106 students in a non-major, undergraduate physics classroom at a mid-sized, private university on the U.S. East Coast. In identical learning assessments issued both before and after the study, students working with LiDAR Motion improved their scores by a more significant margin than those using standard issue sonic rangers. Further, per a voluntary survey, students who used both technologies expressed a preference for LiDAR Motion. This mobile application holds potential for improving student learning in the classroom, at home, and in alternative learning environments.
AI Key Findings
Get AI-generated insights about this paper's methodology, results, significance, and more — seven facets brought into focus.
Impact
Paper Details
Authors
PDF Preview
Key Terms
Citation Network
Current paper (gray), citations (green), references (blue)
Display is limited for performance on very large graphs.
Discussion 0