Evaluation of Local Explanation Methods for Multivariate Time Series Forecasting
Publication
Metrics
AI Quick Summary
This paper proposes two new evaluation metrics—Area Over the Perturbation Curve for Regression and Ablation Percentage Threshold—to assess the local interpretability of time series forecasting models. The study applies these metrics to compare various local explanation models on two datasets, revealing insights into their sensitivity and effectiveness.
Paper Preview
Abstract
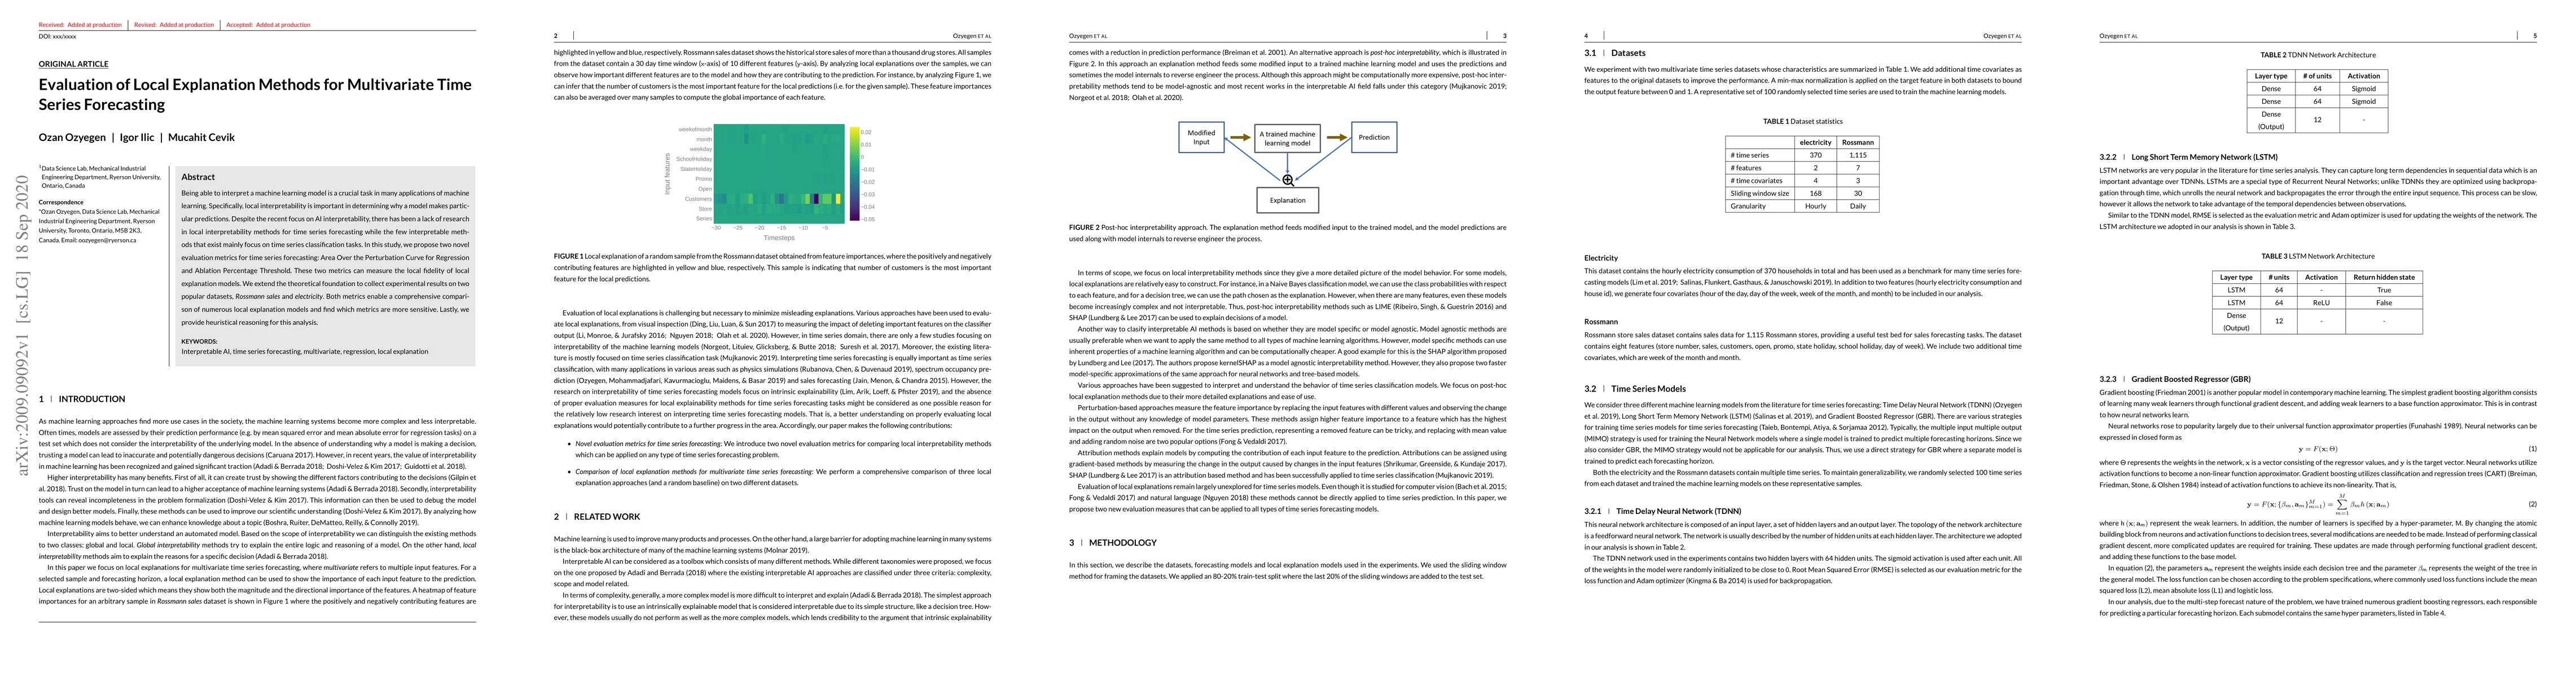
Being able to interpret a machine learning model is a crucial task in many applications of machine learning. Specifically, local interpretability is important in determining why a model makes particular predictions. Despite the recent focus on AI interpretability, there has been a lack of research in local interpretability methods for time series forecasting while the few interpretable methods that exist mainly focus on time series classification tasks. In this study, we propose two novel evaluation metrics for time series forecasting: Area Over the Perturbation Curve for Regression and Ablation Percentage Threshold. These two metrics can measure the local fidelity of local explanation models. We extend the theoretical foundation to collect experimental results on two popular datasets, \textit{Rossmann sales} and \textit{electricity}. Both metrics enable a comprehensive comparison of numerous local explanation models and find which metrics are more sensitive. Lastly, we provide heuristical reasoning for this analysis.
AI Key Findings
Get AI-generated insights about this paper's methodology, results, significance, and more — seven facets brought into focus.
Impact
Paper Details
Authors
PDF Preview
Key Terms
Citation Network
Current paper (gray), citations (green), references (blue)
Display is limited for performance on very large graphs.
Discussion 0