AI Quick Summary
This paper develops a 3D Convolutional Neural Network model for identifying soybean charcoal rot disease using hyperspectral imaging data, achieving 95.73% accuracy. The model's predictions are explained using saliency maps, identifying 733 nm as the most sensitive wavelength in the Near Infrared Region for classification.
Paper Preview
Abstract
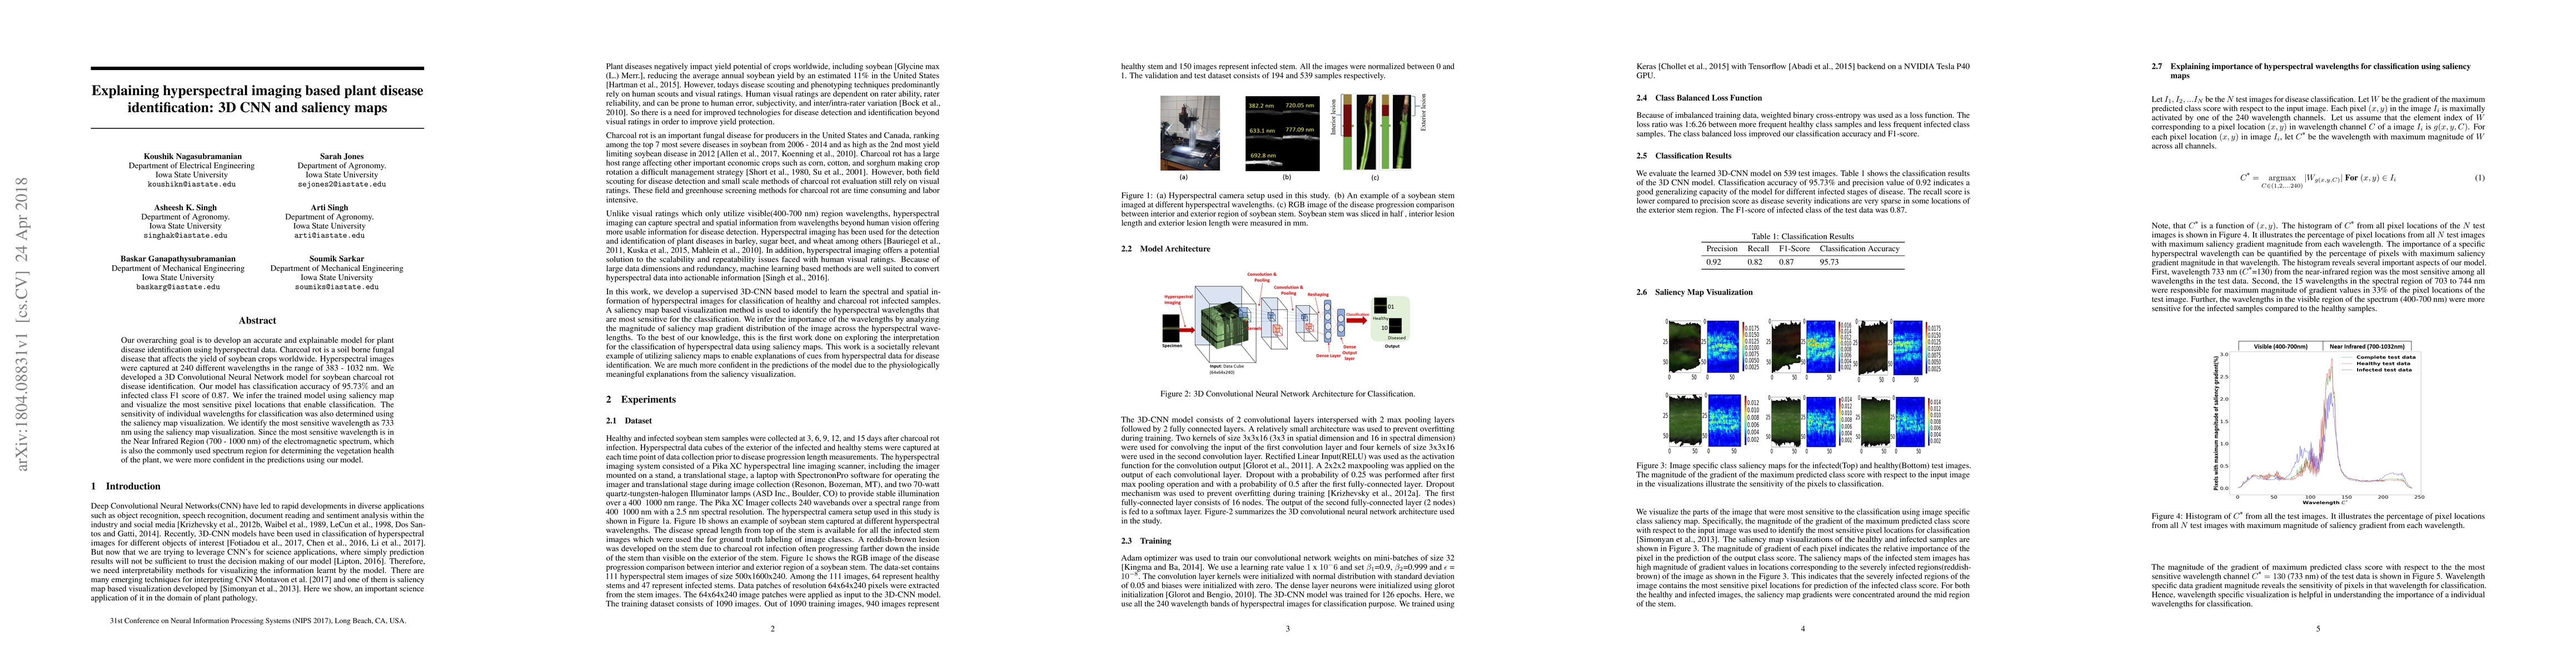
Our overarching goal is to develop an accurate and explainable model for plant disease identification using hyperspectral data. Charcoal rot is a soil borne fungal disease that affects the yield of soybean crops worldwide. Hyperspectral images were captured at 240 different wavelengths in the range of 383 - 1032 nm. We developed a 3D Convolutional Neural Network model for soybean charcoal rot disease identification. Our model has classification accuracy of 95.73\% and an infected class F1 score of 0.87. We infer the trained model using saliency map and visualize the most sensitive pixel locations that enable classification. The sensitivity of individual wavelengths for classification was also determined using the saliency map visualization. We identify the most sensitive wavelength as 733 nm using the saliency map visualization. Since the most sensitive wavelength is in the Near Infrared Region(700 - 1000 nm) of the electromagnetic spectrum, which is also the commonly used spectrum region for determining the vegetation health of the plant, we were more confident in the predictions using our model.
AI Key Findings
Get AI-generated insights about this paper's methodology, results, and significance.
Paper Details
How to Cite This Paper
@article{anon2018explaining,
  title         = {Explaining hyperspectral imaging based plant disease identification: 3D
  CNN and saliency maps},
  year          = {2018},
  eprint        = {1804.08831},
  archivePrefix = {arXiv},
  primaryClass  = {cs.CV},
}(2018). Explaining hyperspectral imaging based plant disease identification: 3D
CNN and saliency maps. arXiv. https://arxiv.org/abs/1804.08831"Explaining hyperspectral imaging based plant disease identification: 3D
CNN and saliency maps." arXiv, 2018, arxiv.org/abs/1804.08831.PDF Preview
Key Terms
Citation Network
Current paper (gray), citations (green), references (blue)
Display is limited for performance on very large graphs.
Similar Papers
Found 4 papersBenchmarking Perturbation-based Saliency Maps for Explaining Atari Agents
Tobias Huber, Benedikt Limmer, Elisabeth André
Identification of yellow vein clearing disease in lemons based on hyperspectral imaging and deep learning.
Li, Xunlan, Peng, Fangfang, Wei, Zhaoxin et al.
Time series saliency maps: explaining models across multiple domains
Christodoulos Kechris, Jonathan Dan, David Atienza
| Title | Authors | Year | Actions |
|---|
Comments (0)