Explanation Shift: Detecting distribution shifts on tabular data via the explanation space
Publication
Metrics
AI Quick Summary
This paper explores how shifts in input data distributions affect both predictive performance and model explanation characteristics for tabular data. It finds that monitoring explanation shifts can be a more effective indicator of predictive performance changes than traditional methods, offering a mathematical analysis and synthetic experiments to support this conclusion.
Paper Preview
Abstract
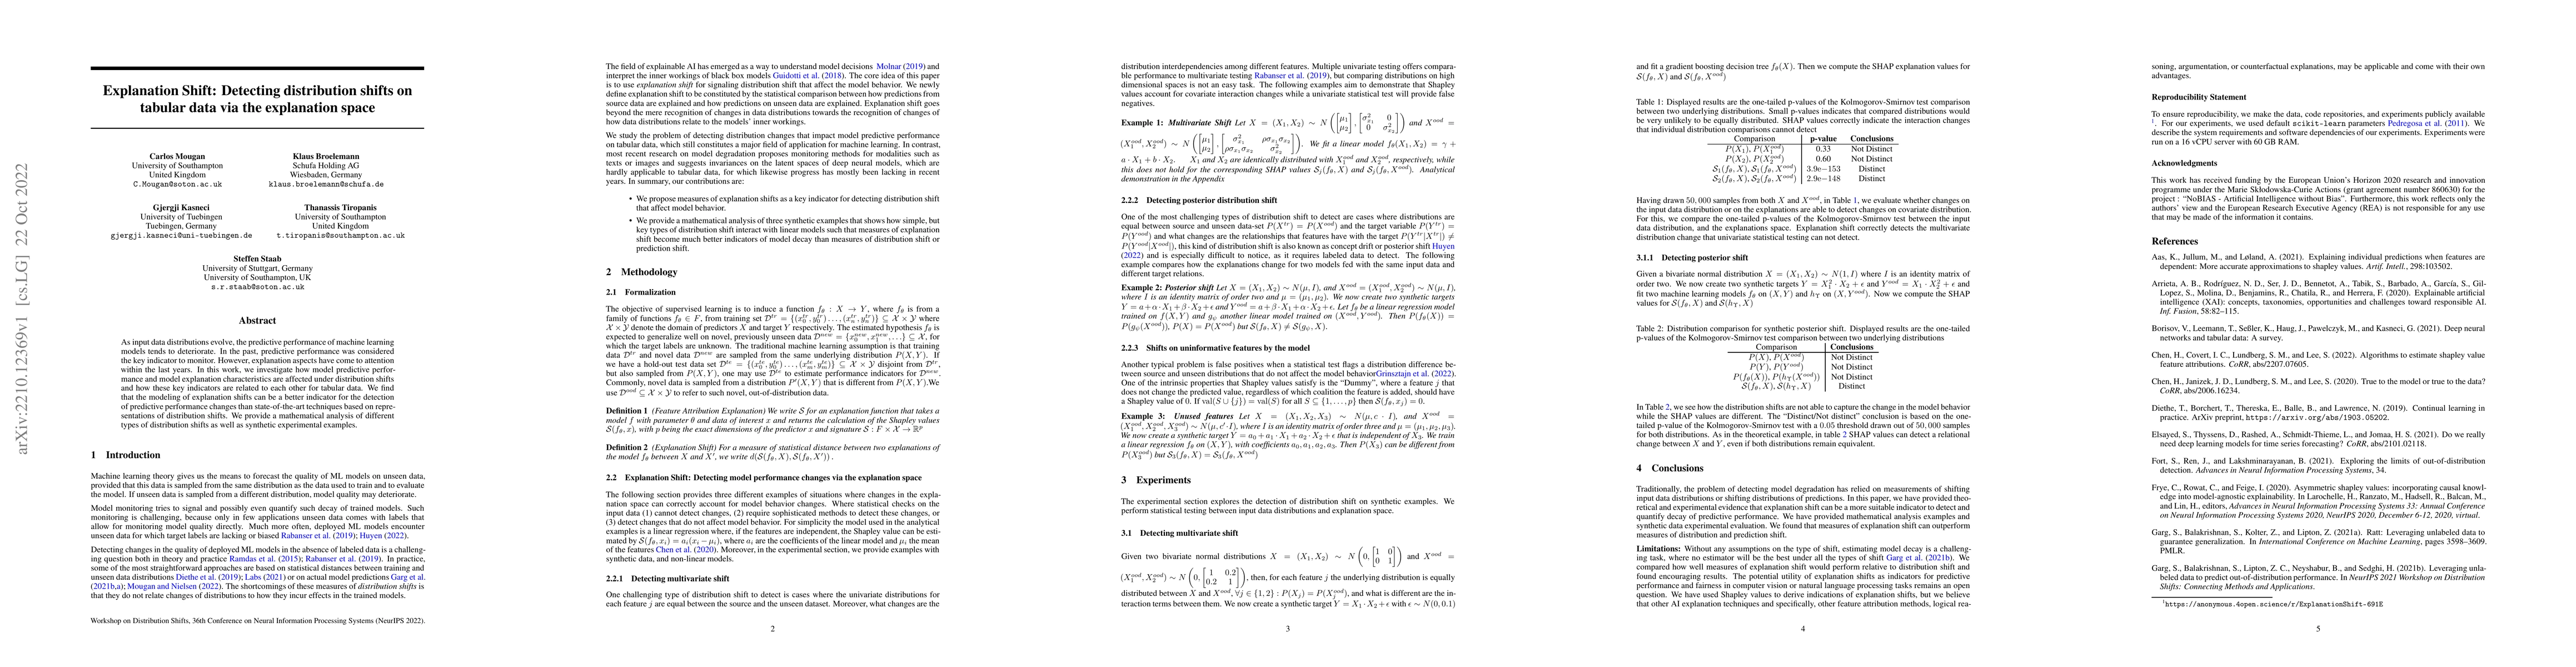
As input data distributions evolve, the predictive performance of machine learning models tends to deteriorate. In the past, predictive performance was considered the key indicator to monitor. However, explanation aspects have come to attention within the last years. In this work, we investigate how model predictive performance and model explanation characteristics are affected under distribution shifts and how these key indicators are related to each other for tabular data. We find that the modeling of explanation shifts can be a better indicator for the detection of predictive performance changes than state-of-the-art techniques based on representations of distribution shifts. We provide a mathematical analysis of different types of distribution shifts as well as synthetic experimental examples.
AI Key Findings
Get AI-generated insights about this paper's methodology, results, significance, and more — seven facets brought into focus.
Impact
Paper Details
Authors
PDF Preview
Key Terms
Citation Network
Current paper (gray), citations (green), references (blue)
Display is limited for performance on very large graphs.
Discussion 0