Publication
Metrics
Paper Preview
Abstract
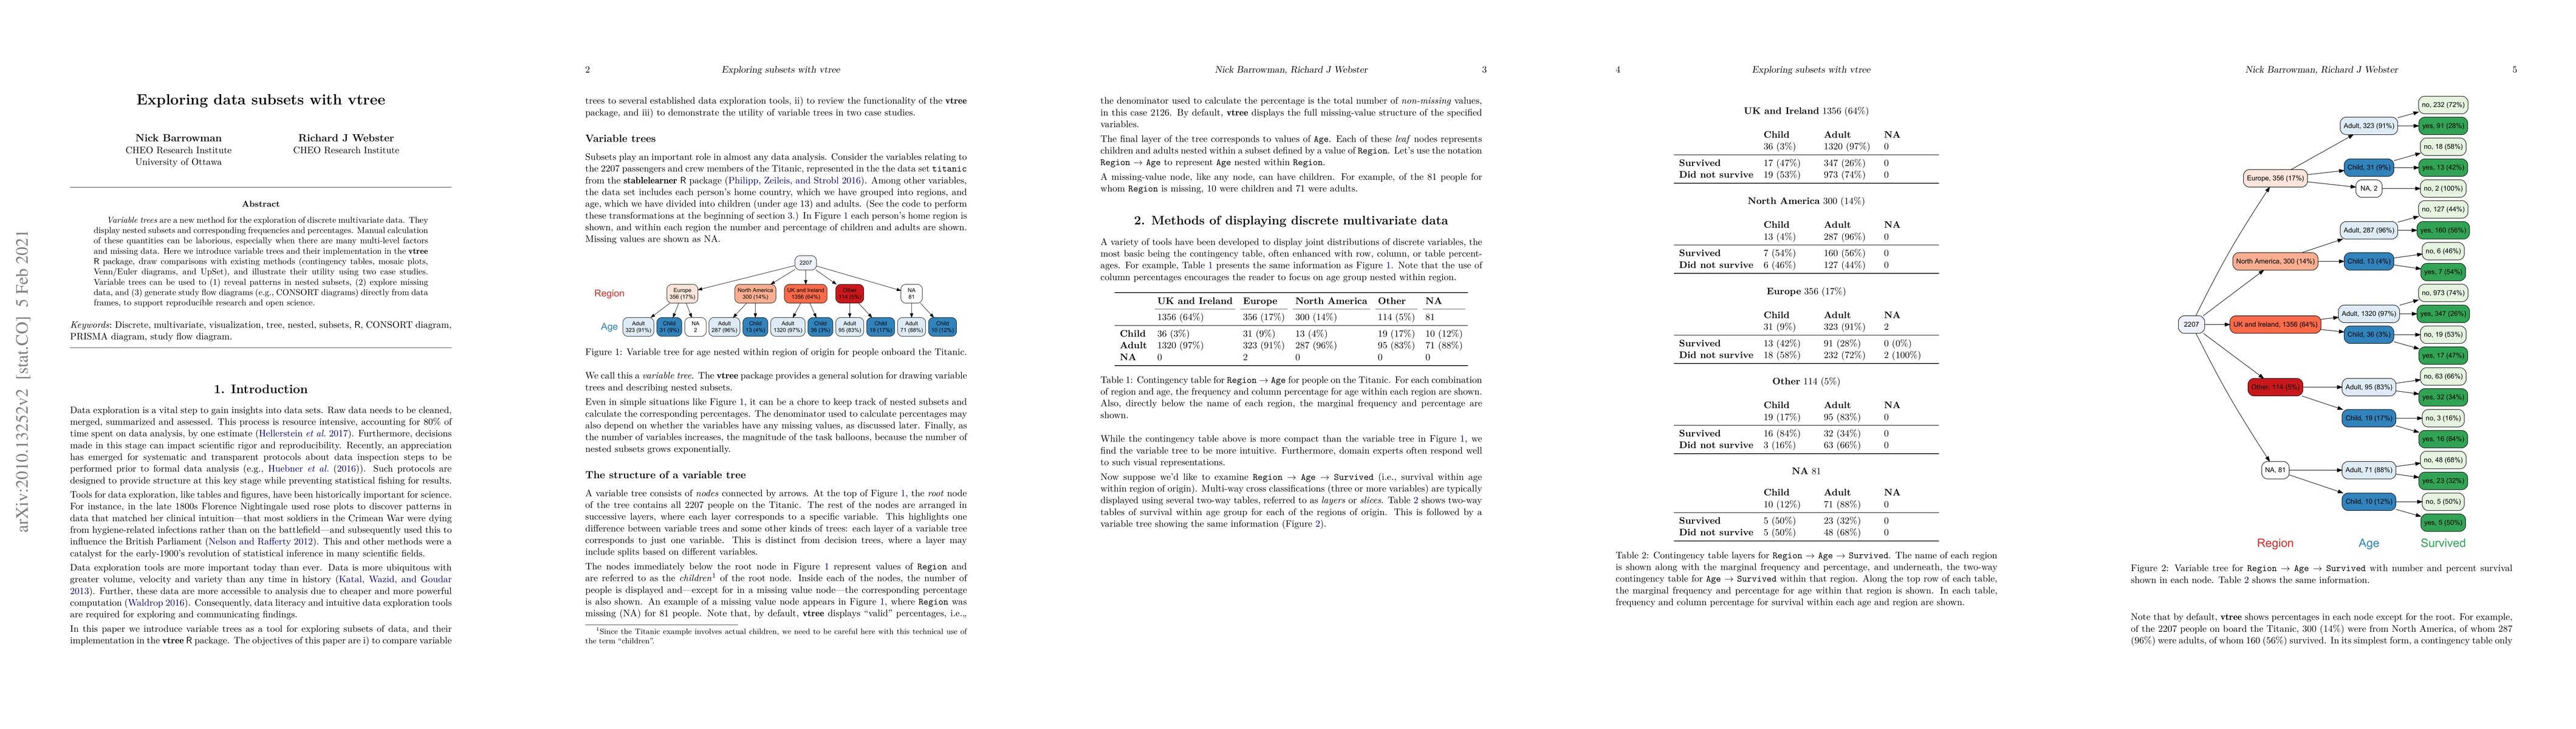
Variable trees are a new method for the exploration of discrete multivariate data. They display nested subsets and corresponding frequencies and percentages. Manual calculation of these quantities can be laborious, especially when there are many multi-level factors and missing data. Here we introduce variable trees and their implementation in the vtree R package, draw comparisons with existing methods (contingency tables, mosaic plots, Venn/Euler diagrams, and UpSet), and illustrate their utility using two case studies. Variable trees can be used to (1) reveal patterns in nested subsets, (2) explore missing data, and (3) generate study flow diagrams (e.g., CONSORT diagrams) directly from data frames, to support reproducible research and open science.
AI Key Findings
Get AI-generated insights about this paper's methodology, results, significance, and more — seven facets brought into focus.
Impact
Paper Details
Authors
PDF Preview
Key Terms
Citation Network
Current paper (gray), citations (green), references (blue)
Display is limited for performance on very large graphs.
Discussion 0