01
MethodologyHow they did it
Brief description of the research methodology used
Researchers analyzed 55 hours of MWA data to detect the redshifted HI hyperfine line from the Epoch of Reionization, finding upper limits on power spectra that could reveal early universe signals.
Researchers analyzed 55 hours of MWA data to detect the redshifted HI hyperfine line from the Epoch of Reionization, finding upper limits on power spectra that could reveal early universe signals.
Brief description of the research methodology used More in Methodology →
Main finding 1 — Main finding 2 More in Key Results →
Why this research is important and its potential impact More in Significance →
Limitation 1 — Limitation 2 More in Limitations →
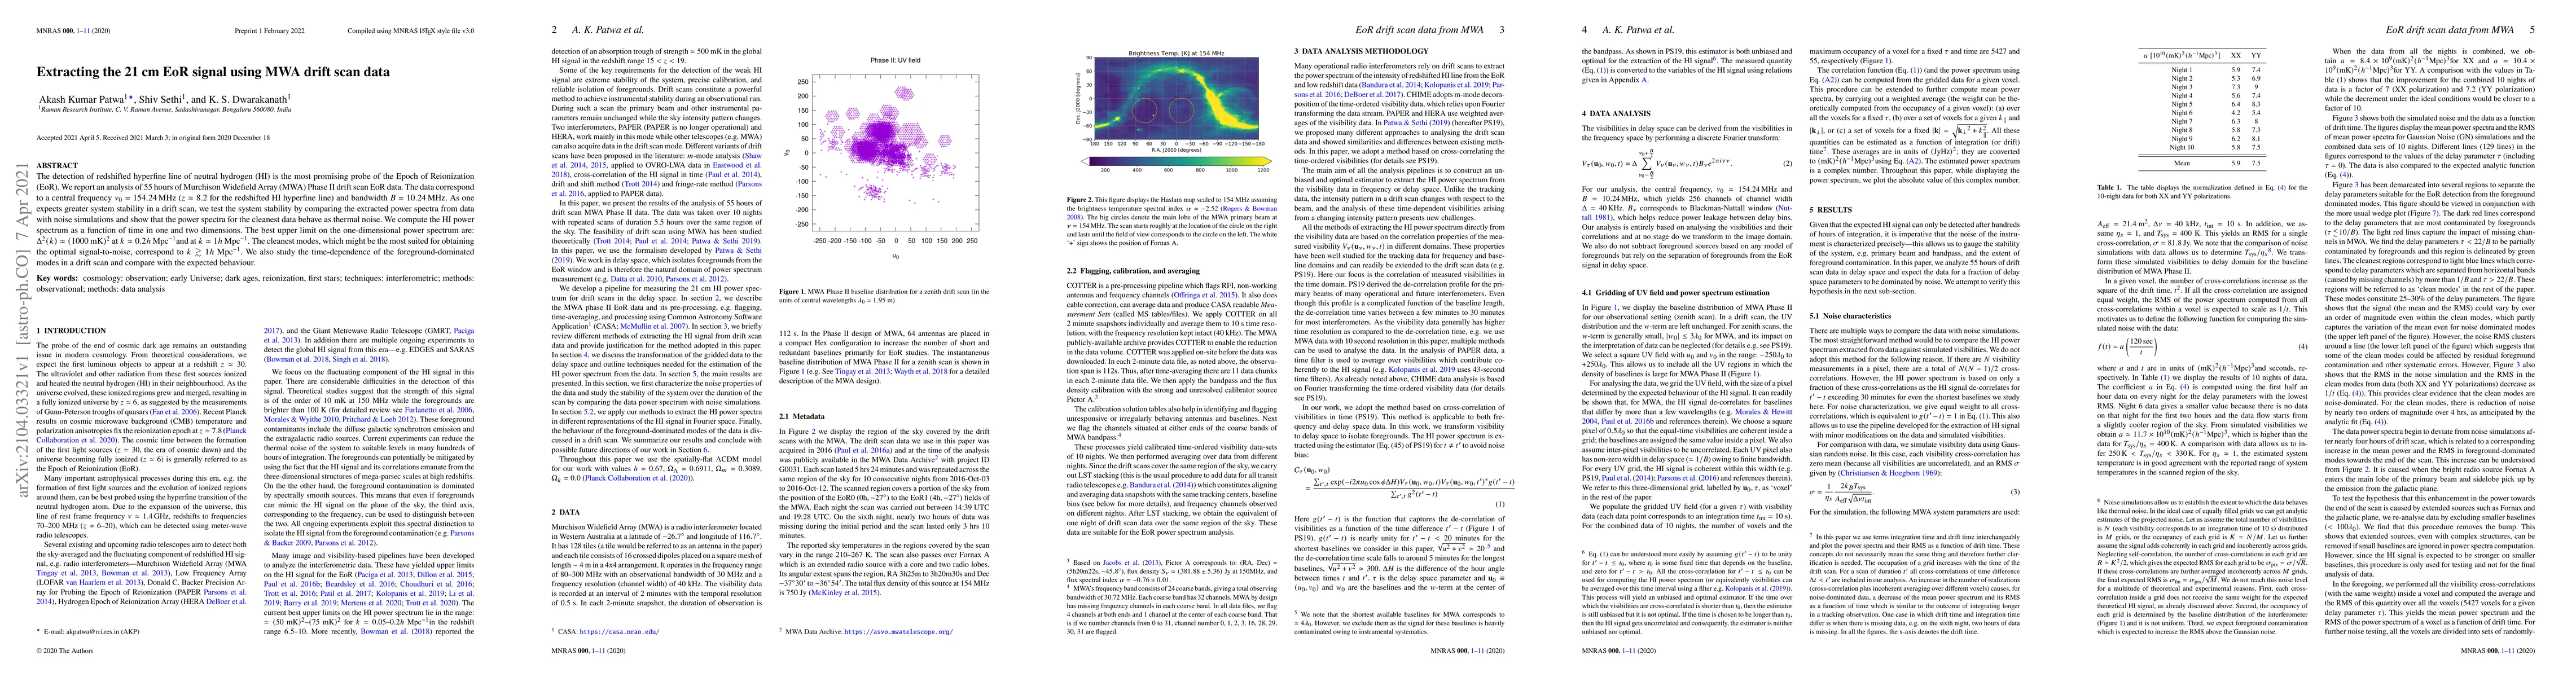
The detection of redshifted hyperfine line of neutral hydrogen (HI) is the most promising probe of the Epoch of Reionization (EoR). We report an analysis of 55 hours of Murchison Widefield Array (MWA) Phase II drift scan EoR data. The data correspond to a central frequency $\nu_0 = 154.24 \, \rm MHz$ ($z\simeq 8.2$ for the redshifted HI hyperfine line) and bandwidth $B = 10.24 \, \rm MHz$. As one expects greater system stability in a drift scan, we test the system stability by comparing the extracted power spectra from data with noise simulations and show that the power spectra for the cleanest data behave as thermal noise. We compute the HI power spectrum as a function of time in one and two dimensions. The best upper limit on the one-dimensional power spectrum are: $\Delta^2(k) \simeq (1000~\rm mK)^2$ at $k \simeq 0.2$$h~{\rm Mpc}^{-1}$ and at $k \simeq 1$$h~{\rm Mpc}^{-1}$. The cleanest modes, which might be the most suited for obtaining the optimal signal-to-noise, correspond to $k \gtrsim 1$$h~{\rm Mpc}^{-1}$. We also study the time-dependence of the foreground-dominated modes in a drift scan and compare with the expected behaviour.
Seven facets of this paper, analysed and brought into focus by AI.
Why this research is important and its potential impact
Brief description of the research methodology used
Why this research is important and its potential impact
Main technical or theoretical contribution
What makes this work novel or different from existing research
Current paper (gray), citations (green), references (blue)
Display is limited for performance on very large graphs.
Discussion 0