$F$ tests for the strip-split plot design
1507.07466
REVISTA BRASILEIRA DE BIOMETRIA, [S.I.], v. 34, n. 2, p. 279-303,
June 2016
Published Jan 26, 2021
Publication
Published:
Jan 26, 2021
Updated:
Jun 02, 2025
Categories:
stat.ME
Metrics
Source:
ArXiv
Paper Preview
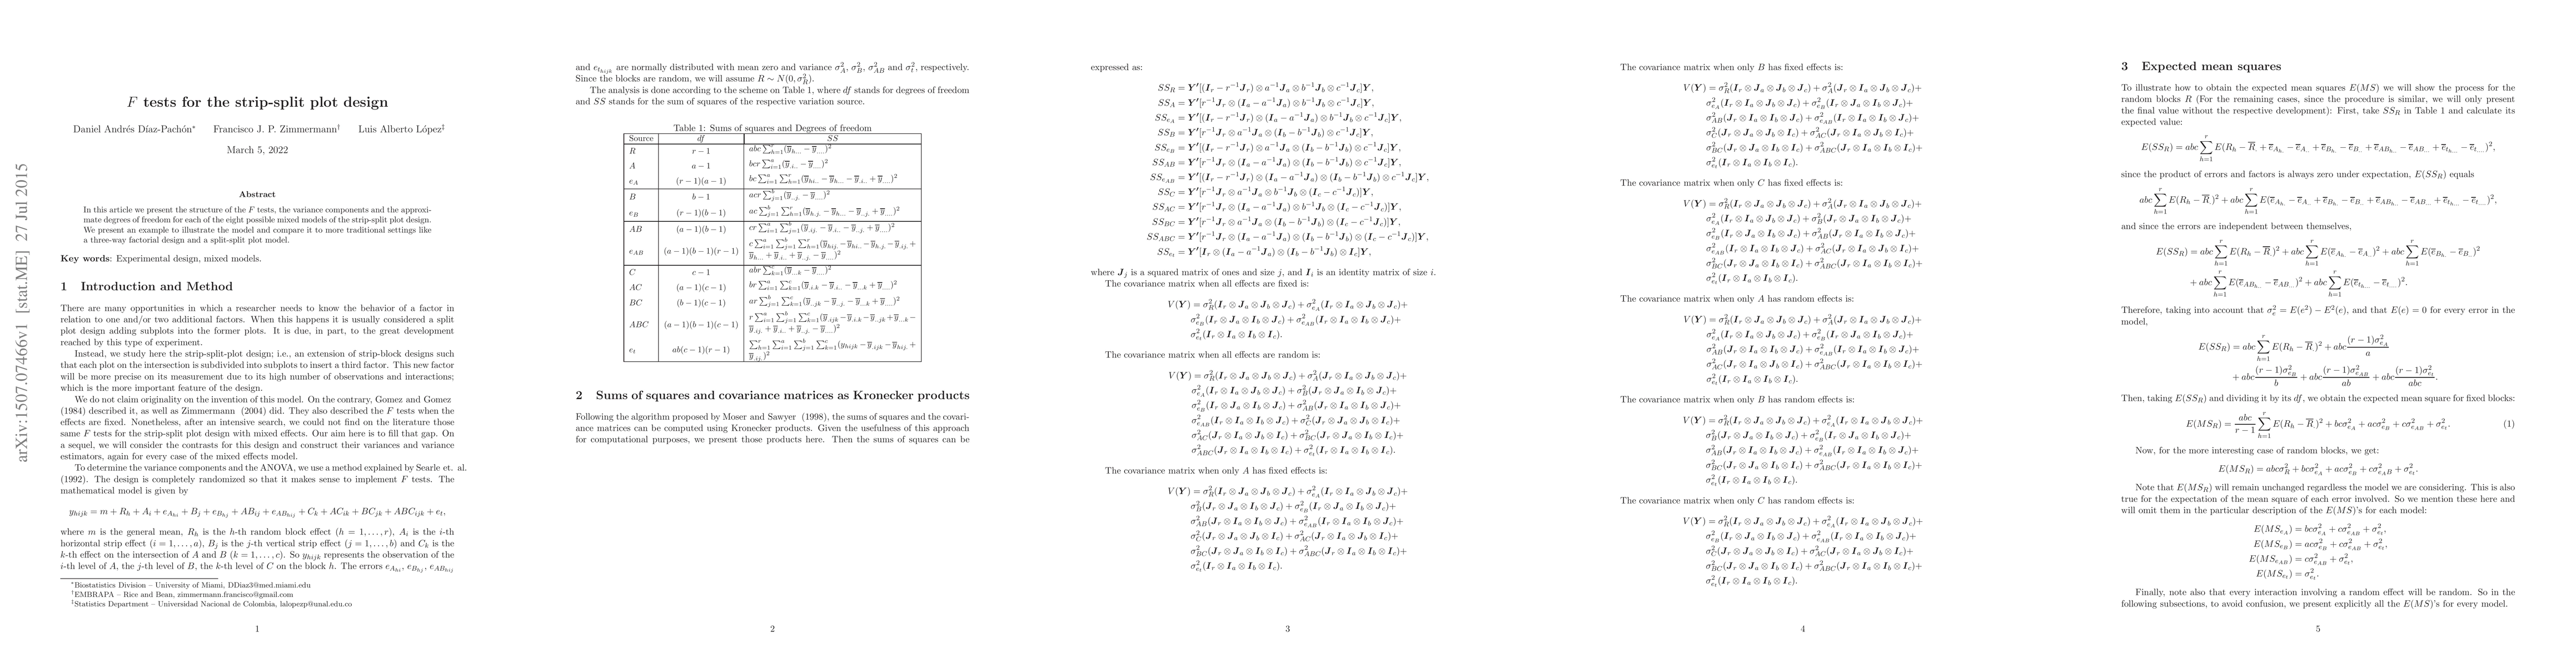
Abstract
In this article we present the structure of the $F$ tests, the variance components and the approximate degrees of freedom for each of the eight possible mixed models of the strip-split plot design. We present an example to illustrate the model and compare it to more traditional settings like a three-way factorial design and a split-split plot model.
AI Key Findings
Get AI-generated insights about this paper's methodology, results, significance, and more — seven facets brought into focus.
Impact
9
References
Paper Details
Paper ID:
1507.07466
Journal:
REVISTA BRASILEIRA DE BIOMETRIA, [S.I.], v. 34, n. 2, p. 279-303,
June 2016
License:
http://arxiv.org/licenses/nonexclusive-distrib/1.0/
Comments:
22 pages
Categories:
stat.ME
Authors
PDF Preview
Key Terms
split
(0.479)
factorial
(0.273)
design
(0.250)
variance
(0.213)
degrees freedom
(0.211)
freedom
(0.200)
tests
(0.200)
settings
(0.196)
Citation Network
Current paper (gray), citations (green), references (blue)
Display is limited for performance on very large graphs.
Current Paper
Citations
References
Click to view
Discussion 0