They reanalyzed RHESSI hard X‑ray and GOES soft X‑ray light curves for 96 flares, compared peak times, and proposed a model where electron acceleration occurs at the loop top and is quenched by increased density build‑up.
Publication
Metrics
Quick Answers
What methodology did the authors use?
They reanalyzed RHESSI hard X‑ray and GOES soft X‑ray light curves for 96 flares, compared peak times, and proposed a model where electron acceleration occurs at the loop top and is quenched by increased density build‑up. More in Methodology →
What are the key results?
The correlation between the HXR–SXR delay and loop length can be explained by acceleration at the loop top being halted by density build‑up. — Reinterpreting multi‑peak events shortens the effective delay, yielding an average up‑flow velocity of ~100 km s⁻¹, consistent with EUV blue‑shift measurements. More in Key Results →
Why is this work significant?
The study offers a physically motivated alternative to the standard evaporation‑time interpretation, providing a baseline for understanding more complex flare events and linking acceleration physics to observable loop dynamics. More in Significance →
What are the main limitations?
The model assumes density alone quenches acceleration, neglecting other possible factors such as magnetic topology or turbulence. — It is based on a limited sample of 96 flares and focuses on events that closely follow the Neupert effect, so its applicability to all flare classes remains uncertain. More in Limitations →
Abstract
This Research Note is in response to the recent paper by S. M. Perriyil et al. (2026). They provide measurements of the time delay (delta t) between the hard X-ray and soft X-ray peak times for 96 flares observed with RHESSI and GOES. These delays are found to be dependent on the length of 9 the magnetic loop(s) joining the HXR footpoints seen in RHESSI images. We offer a possible explanation for this coincidence in terms of the duration of the electron beam heating, commonly inferred from the duration of the HXR emission, and the time taken for heated plasma to rise to the loop top as inferred in this paper from delta t. We suggest that the particle acceleration occurs at or near the top of the loop(s) and that it is quenched by the increase in density as the heated plasma reaches the acceleration site.
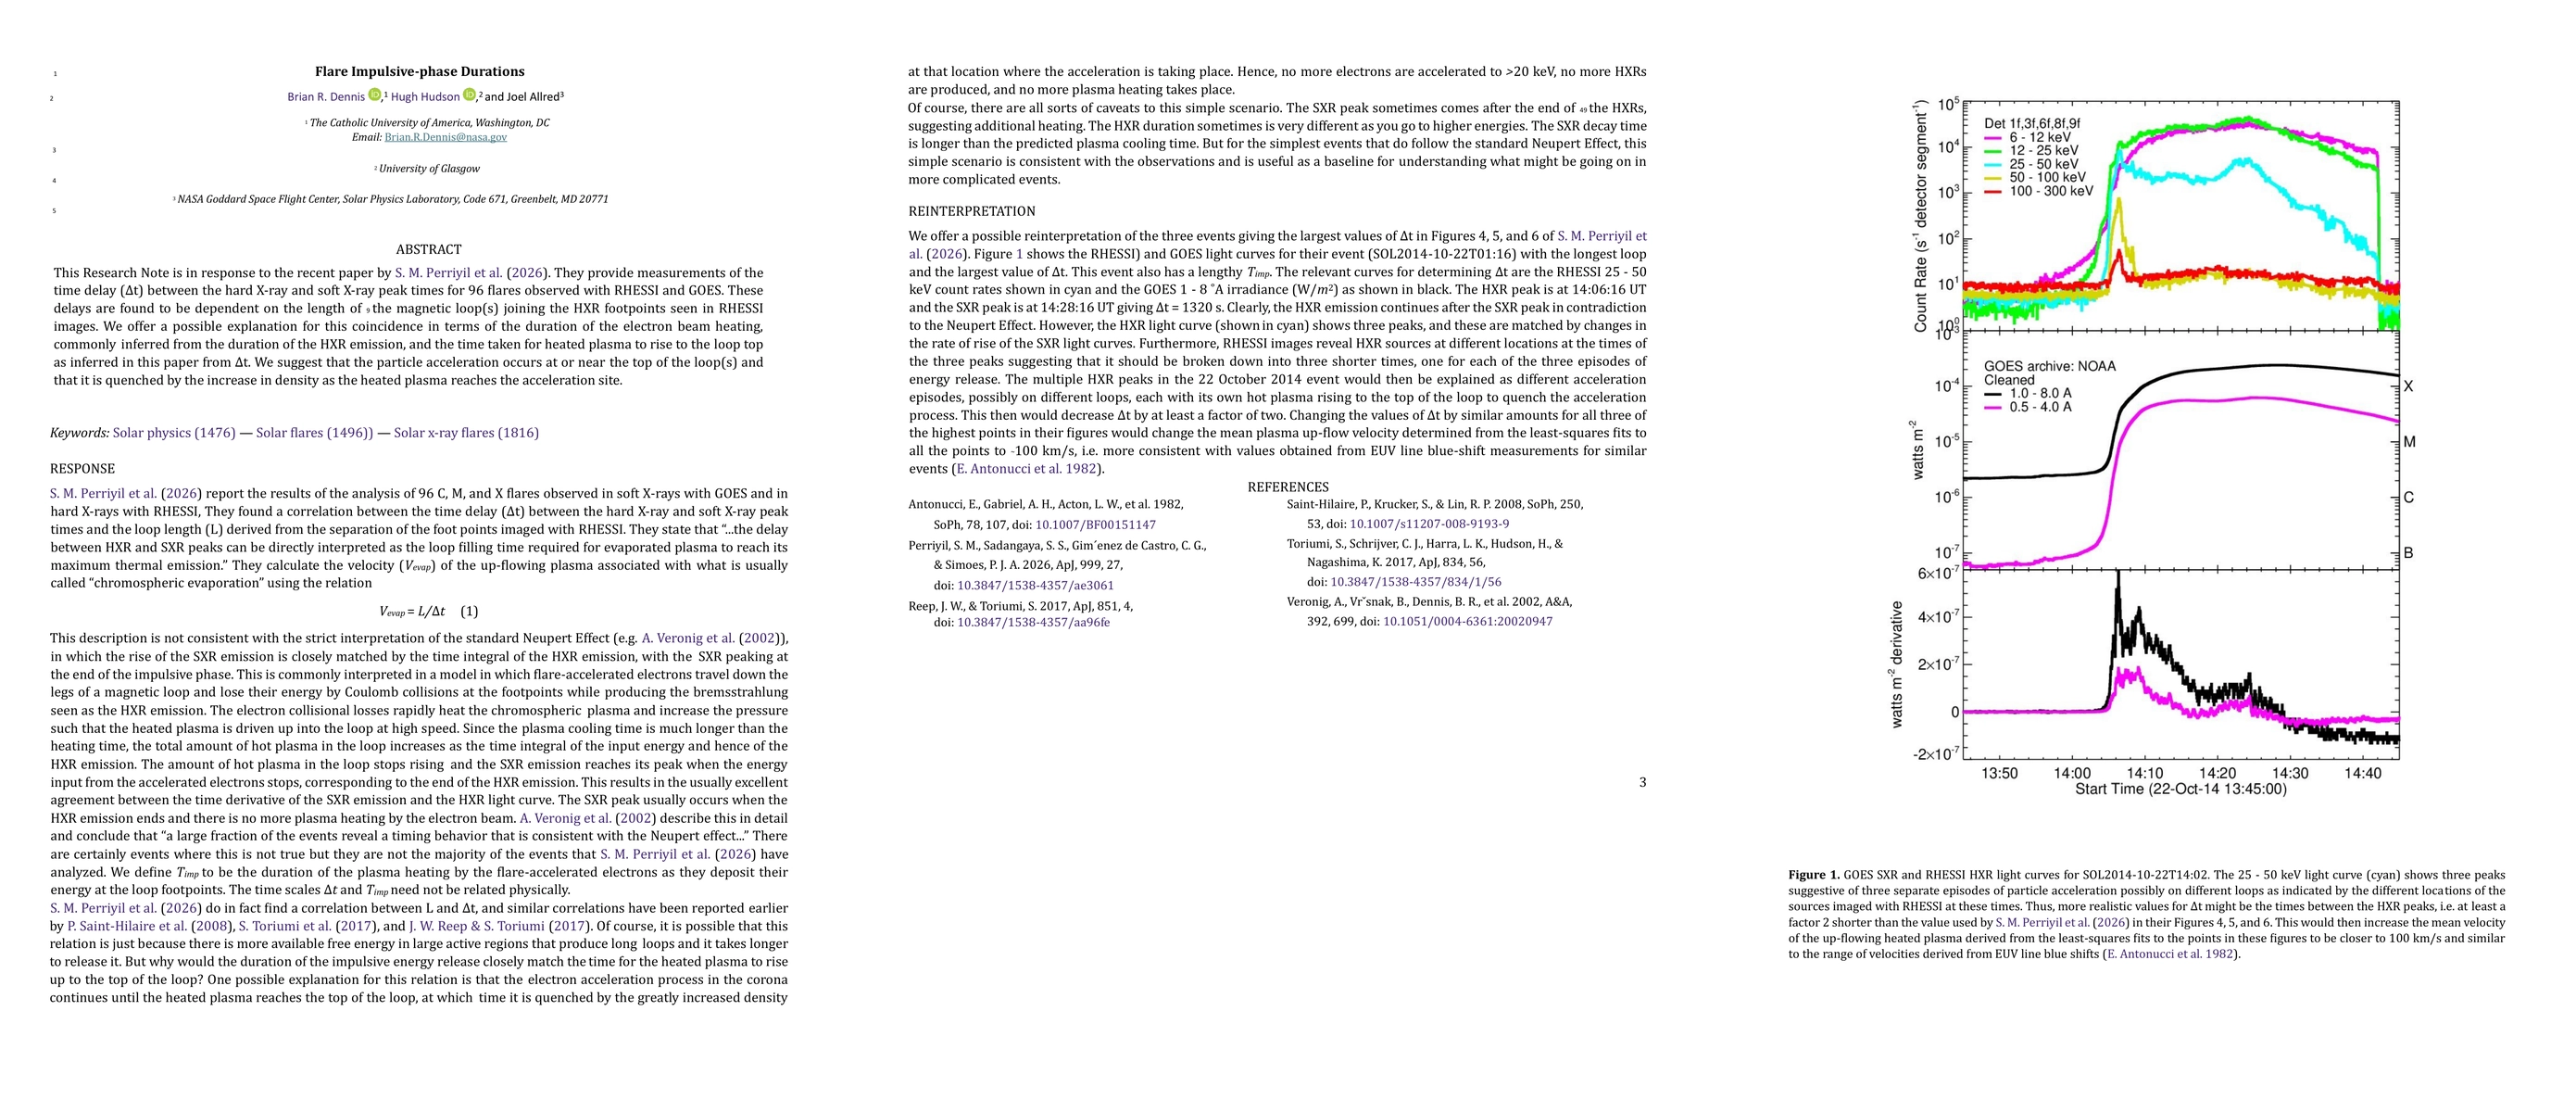
Key Findings, in focus
Seven facets of this paper, analysed and brought into focus by AI.
The study offers a physically motivated alternative to the standard evaporation‑time interpretation, providing a baseline for understanding more complex flare events and linking acceleration physics to observable loop dynamics.
- The correlation between the HXR–SXR delay and loop length can be explained by acceleration at the loop top being halted by density build‑up.
- Reinterpreting multi‑peak events shortens the effective delay, yielding an average up‑flow velocity of ~100 km s⁻¹, consistent with EUV blue‑shift measurements.
- This revised interpretation removes the need for unusually long evaporation times and aligns the Neupert‑effect timing with observed plasma dynamics.
The study offers a physically motivated alternative to the standard evaporation‑time interpretation, providing a baseline for understanding more complex flare events and linking acceleration physics to observable loop dynamics.
They reinterpret the Δt–loop‑length correlation by linking the delay to the time for evaporated plasma to reach the loop top, and derive a realistic up‑flow velocity (~100 km s⁻¹) from revised delay estimates.
This work is the first to attribute the HXR–SXR delay to loop‑top density quenching of electron acceleration and to correct multi‑peak events, thereby reconciling observed delays with EUV‑derived plasma velocities.
- The model assumes density alone quenches acceleration, neglecting other possible factors such as magnetic topology or turbulence.
- It is based on a limited sample of 96 flares and focuses on events that closely follow the Neupert effect, so its applicability to all flare classes remains uncertain.
- Perform detailed numerical simulations of coronal acceleration and density evolution to test the quenching hypothesis.
- Use high‑resolution imaging spectroscopy to identify multiple acceleration sites and validate the multi‑peak reinterpretation.
- Extend the analysis to a larger, more diverse flare dataset to assess the universality of the Δt–L correlation.
Discussion 0