Fluorescence spectrum analysis using Fourier series modeling for Fluorescein solution in Ethanol
Publication
Metrics
Paper Preview
Abstract
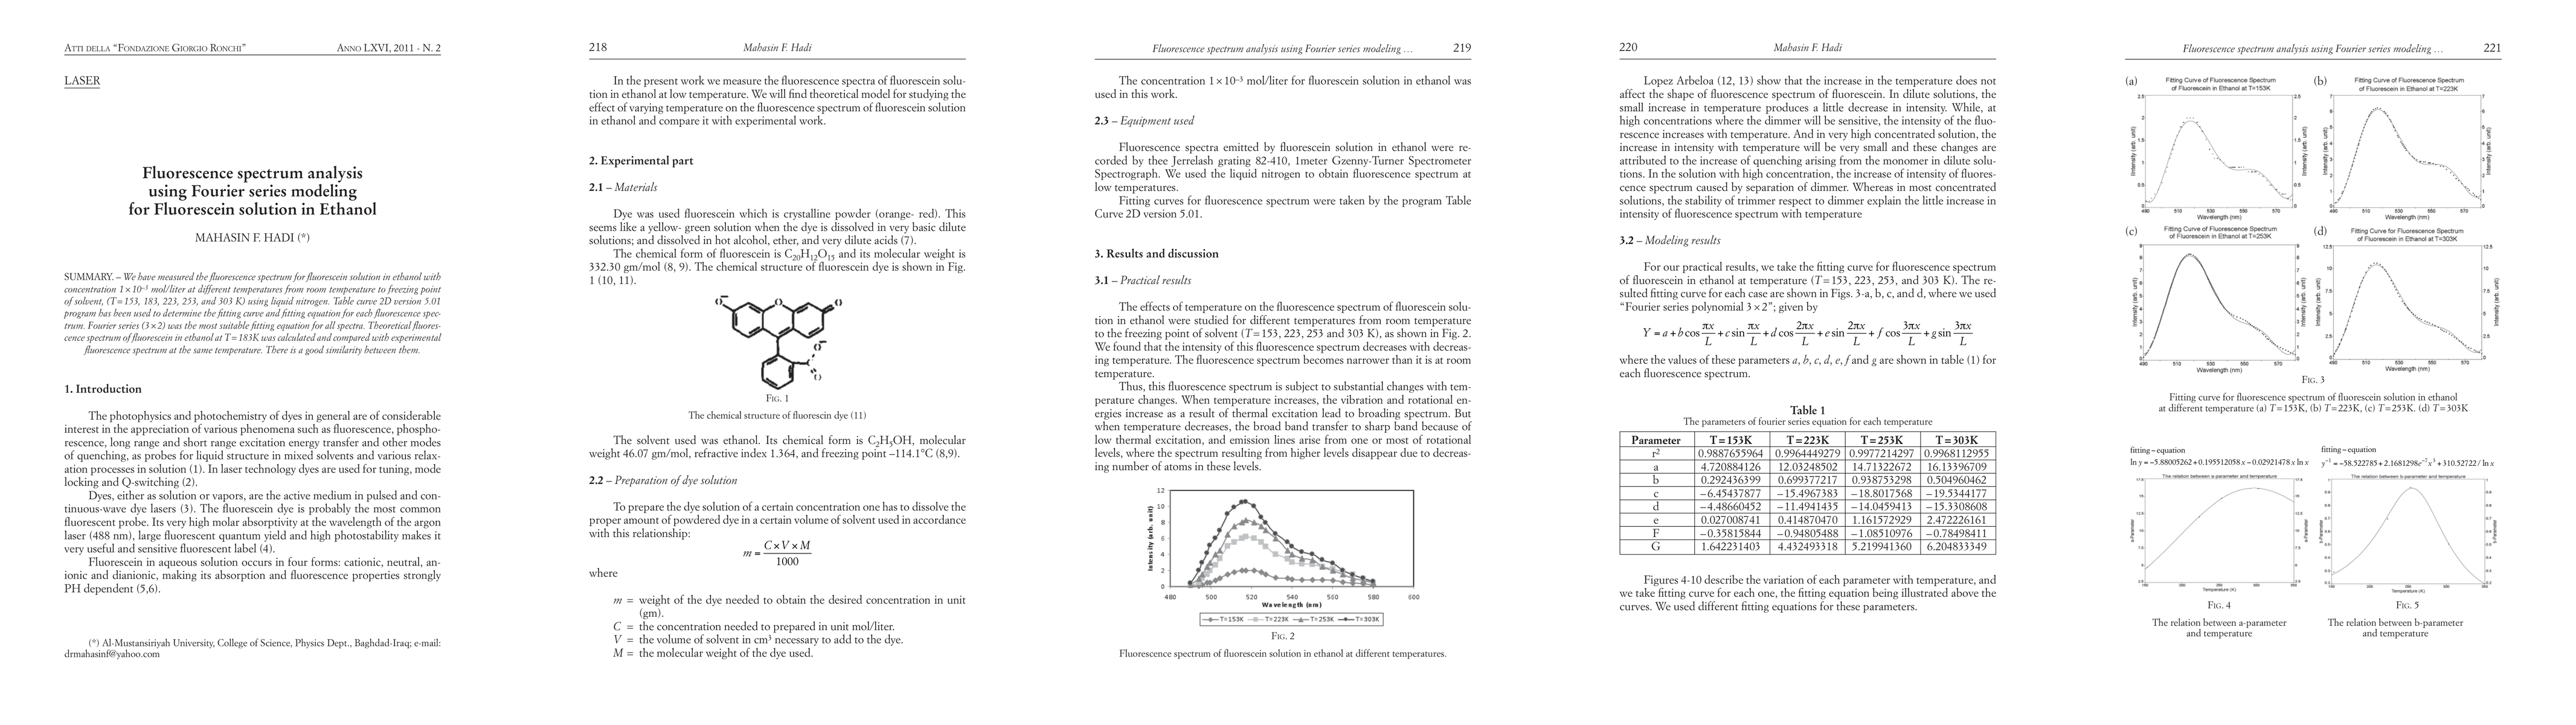
We have measured the fluorescence spectrum for fluorescein solution in ethanol with concentration 1 {\times} 10-3 mol/liter at different temperatures from room temperature to freezing point of solvent, (T = 153, 183, 223, 253, and 303 K) using liquid nitrogen. Table curve 2D version 5.01 program has been used to determine the fitting curve and fitting equation for each fluorescence spectrum. Fourier series (3 {\times} 2) was the most suitable fitting equation for all spectra. Theoretical fluorescence spectrum of fluorescein in ethanol at T = 183K was calculated and compared with experimental fluorescence spectrum at the same temperature. There is a good similarity between them.
AI Key Findings
Get AI-generated insights about this paper's methodology, results, significance, and more — seven facets brought into focus.
Impact
Paper Details
PDF Preview
Key Terms
Citation Network
Current paper (gray), citations (green), references (blue)
Display is limited for performance on very large graphs.
Discussion 0