Publication
Metrics
AI Quick Summary
This paper examines how different dust sources and geometries affect dust attenuation curves in high-redshift galaxies, finding that attenuation curves can vary significantly despite different grain size distributions. It concludes that distinguishing dust sources solely by attenuation curves is challenging, but the IRX-$\beta$ relation can provide additional insights into the dominant dust source.
Paper Preview
Abstract
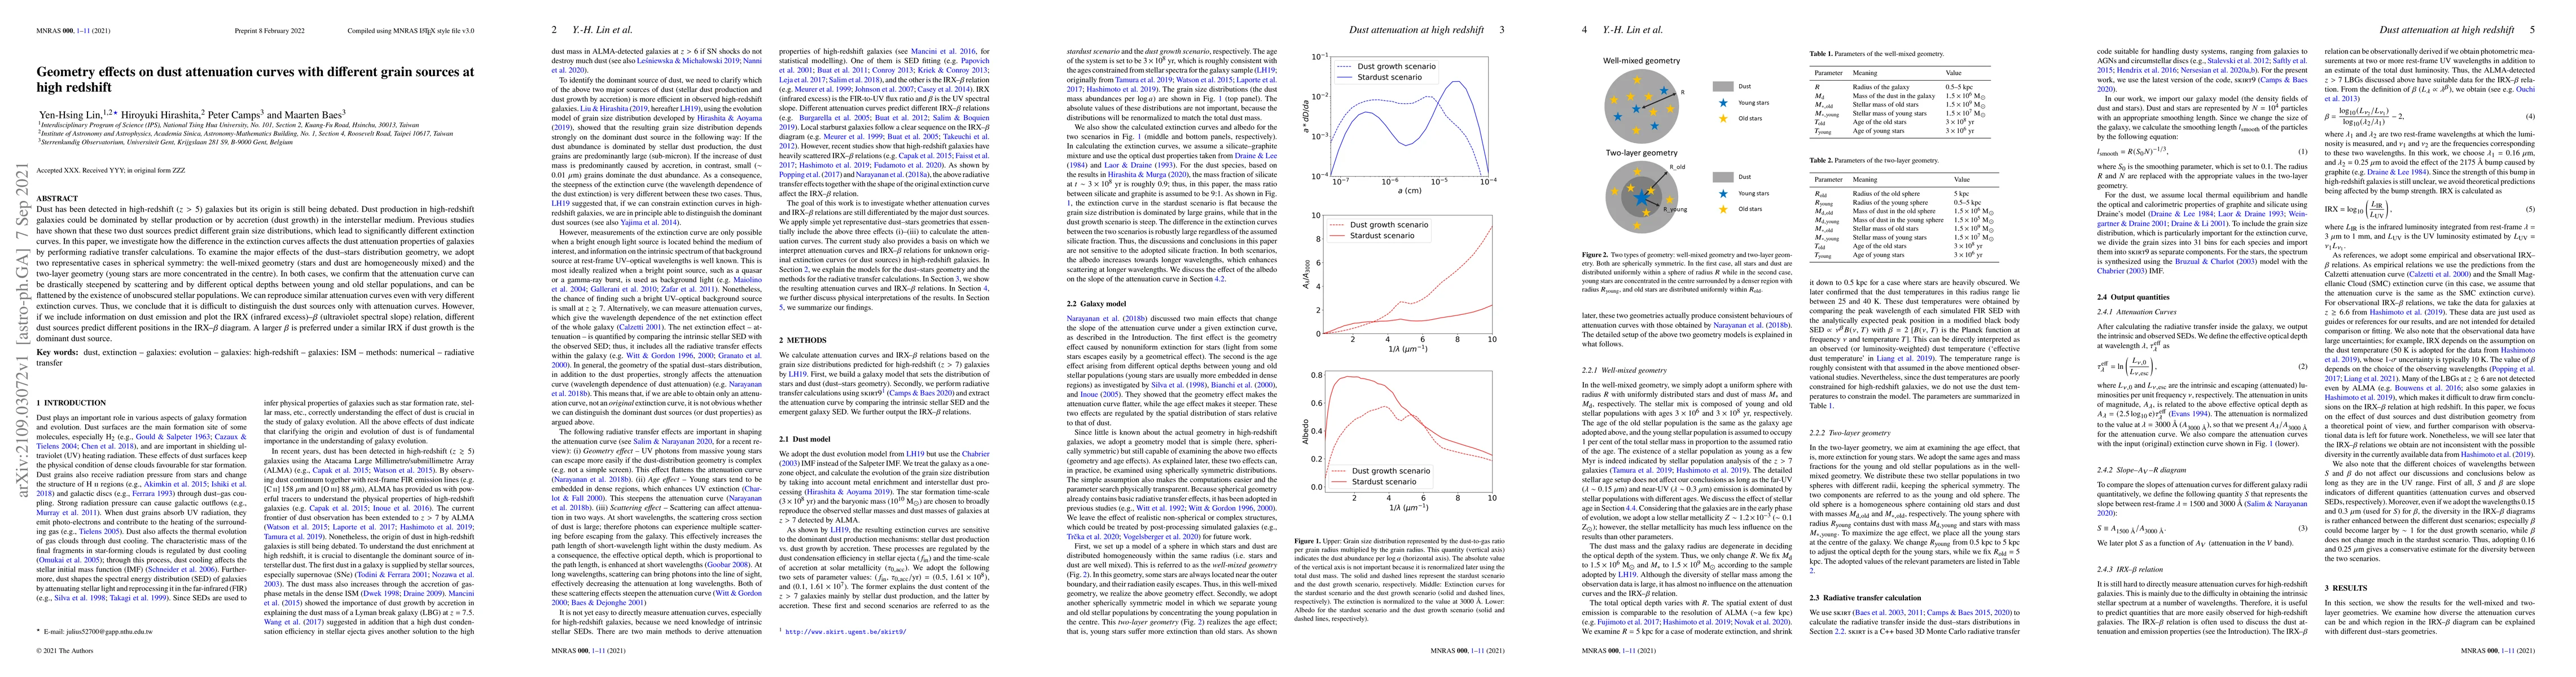
Dust has been detected in high-redshift ($z>5$) galaxies but its origin is still being debated. Dust production in high-redshift galaxies could be dominated by stellar production or by accretion (dust growth) in the interstellar medium. Previous studies have shown that these two dust sources predict different grain size distributions, which lead to significantly different extinction curves. In this paper, we investigate how the difference in the extinction curves affects the dust attenuation properties of galaxies by performing radiative transfer calculations. To examine the major effects of the dust--stars distribution geometry, we adopt two representative cases in spherical symmetry: the well-mixed geometry (stars and dust are homogeneously mixed) and the two-layer geometry (young stars are more concentrated in the centre). In both cases, we confirm that the attenuation curve can be drastically steepened by scattering and by different optical depths between young and old stellar populations, and can be flattened by the existence of unobscured stellar populations. We can reproduce similar attenuation curves even with very different extinction curves. Thus, we conclude that it is difficult to distinguish the dust sources only with attenuation curves. However, if we include information on dust emission and plot the IRX (infrared excess)--$\beta$ (ultraviolet spectral slope) relation, different dust sources predict different positions in the IRX--$\beta$ diagram. A larger $\beta$ is preferred under a similar IRX if dust growth is the dominant dust source.
AI Key Findings
Get AI-generated insights about this paper's methodology, results, significance, and more — seven facets brought into focus.
Impact
Paper Details
Authors
PDF Preview
Key Terms
Citation Network
Current paper (gray), citations (green), references (blue)
Display is limited for performance on very large graphs.
Discussion 0