Publication
Metrics
Paper Preview
Abstract
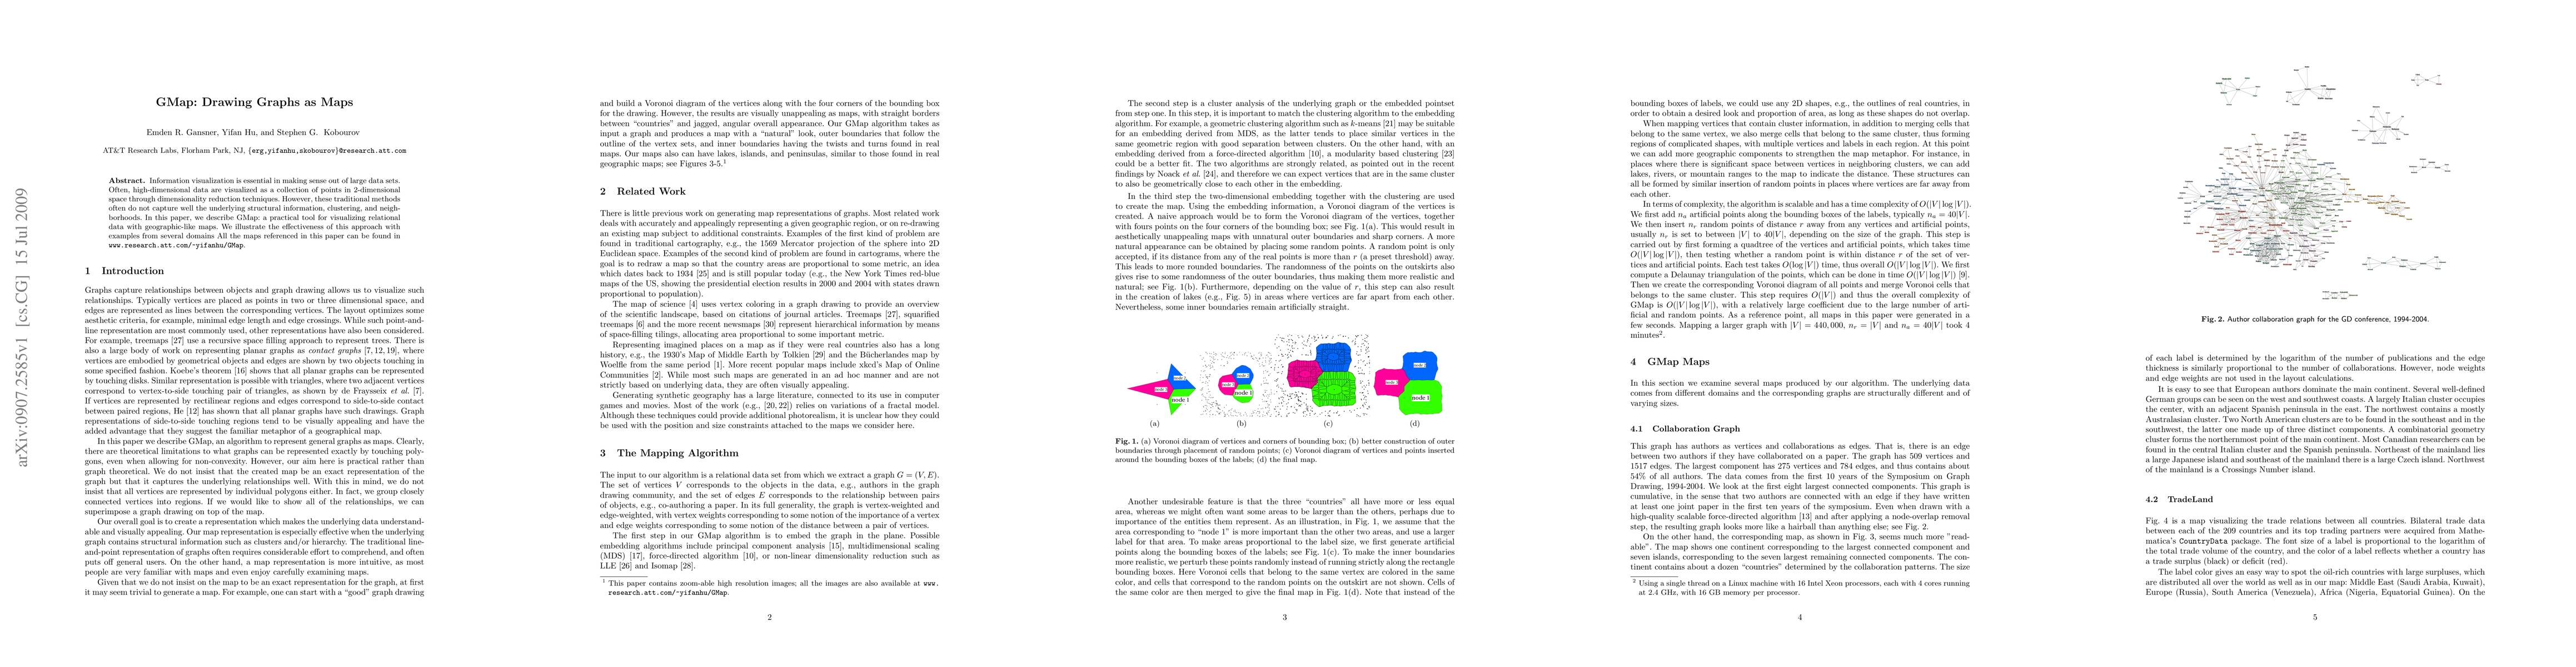
Information visualization is essential in making sense out of large data sets. Often, high-dimensional data are visualized as a collection of points in 2-dimensional space through dimensionality reduction techniques. However, these traditional methods often do not capture well the underlying structural information, clustering, and neighborhoods. In this paper, we describe GMap: a practical tool for visualizing relational data with geographic-like maps. We illustrate the effectiveness of this approach with examples from several domains All the maps referenced in this paper can be found in http://www.research.att.com/~yifanhu/GMap
AI Key Findings
Get AI-generated insights about this paper's methodology, results, significance, and more — seven facets brought into focus.
Impact
Paper Details
PDF Preview
Key Terms
Citation Network
Current paper (gray), citations (green), references (blue)
Display is limited for performance on very large graphs.
Discussion 0