Graph-constrained Analysis for Multivariate Functional Data
Publication
Metrics
AI Quick Summary
This paper proposes a new method for analyzing multivariate functional data that adheres to a predefined inter-variable graph, leveraging the equivalence between partially separable functional Gaussian graphical models and graphical Gaussian processes. The developed algorithm uses Dempster's covariance selection to calculate the maximum likelihood estimate while preserving marginal distributions, offering improved computational scalability and better handling of the given graph constraints.
Paper Preview
Abstract
Functional Gaussian graphical models (GGM) used for analyzing multivariate functional data customarily estimate an unknown graphical model representing the conditional relationships between the functional variables. However, in many applications of multivariate functional data, the graph is known and existing functional GGM methods cannot preserve a given graphical constraint. In this manuscript, we demonstrate how to conduct multivariate functional analysis that exactly conforms to a given inter-variable graph. We first show the equivalence between partially separable functional GGM and graphical Gaussian processes (GP), proposed originally for constructing optimal covariance functions for multivariate spatial data that retain the conditional independence relations in a given graphical model. The theoretical connection help design a new algorithm that leverages Dempster's covariance selection to calculate the maximum likelihood estimate of the covariance function for multivariate functional data under graphical constraints. We also show that the finite term truncation of functional GGM basis expansion used in practice is equivalent to a low-rank graphical GP, which is known to oversmooth marginal distributions. To remedy this, we extend our algorithm to better preserve marginal distributions while still respecting the graph and retaining computational scalability. The insights obtained from the new results presented in this manuscript will help practitioners better understand the relationship between these graphical models and in deciding on the appropriate method for their specific multivariate data analysis task. The benefits of the proposed algorithms are illustrated using empirical experiments and an application to functional modeling of neuroimaging data using the connectivity graph among regions of the brain.
AI Key Findings
Get AI-generated insights about this paper's methodology, results, significance, and more — seven facets brought into focus.
Impact
Paper Details
Authors
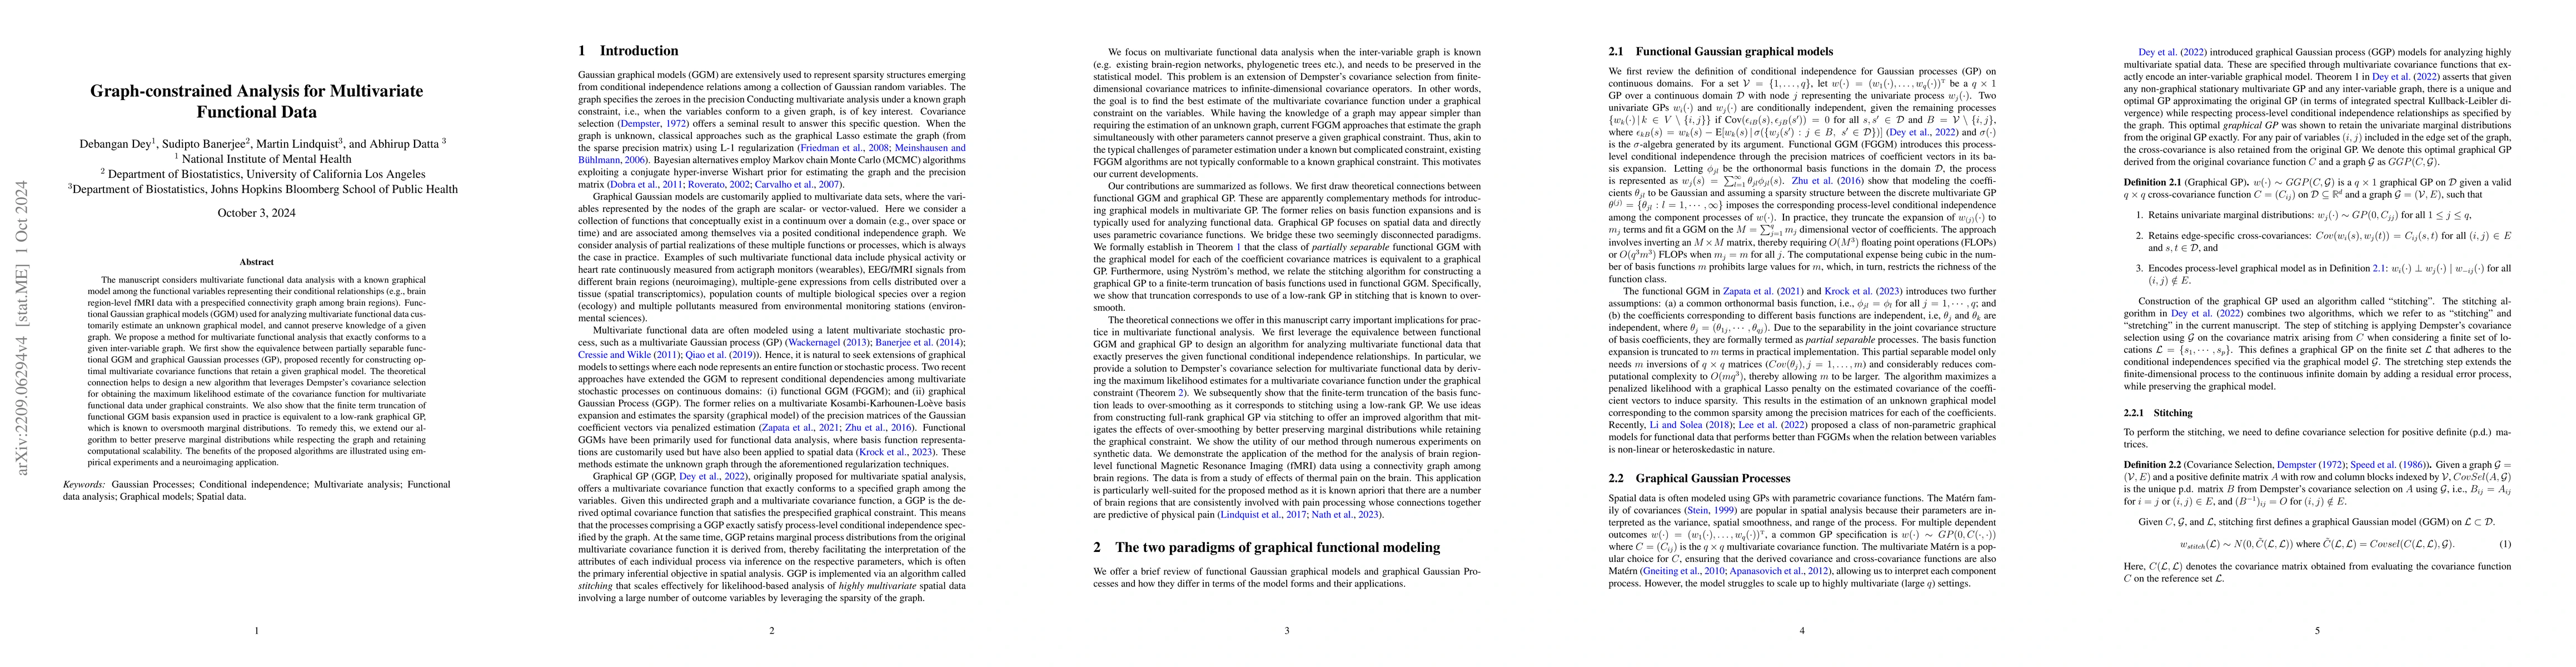
PDF Preview
Key Terms
Citation Network
Current paper (gray), citations (green), references (blue)
Display is limited for performance on very large graphs.
Discussion 0