Publication
Metrics
Paper Preview
Abstract
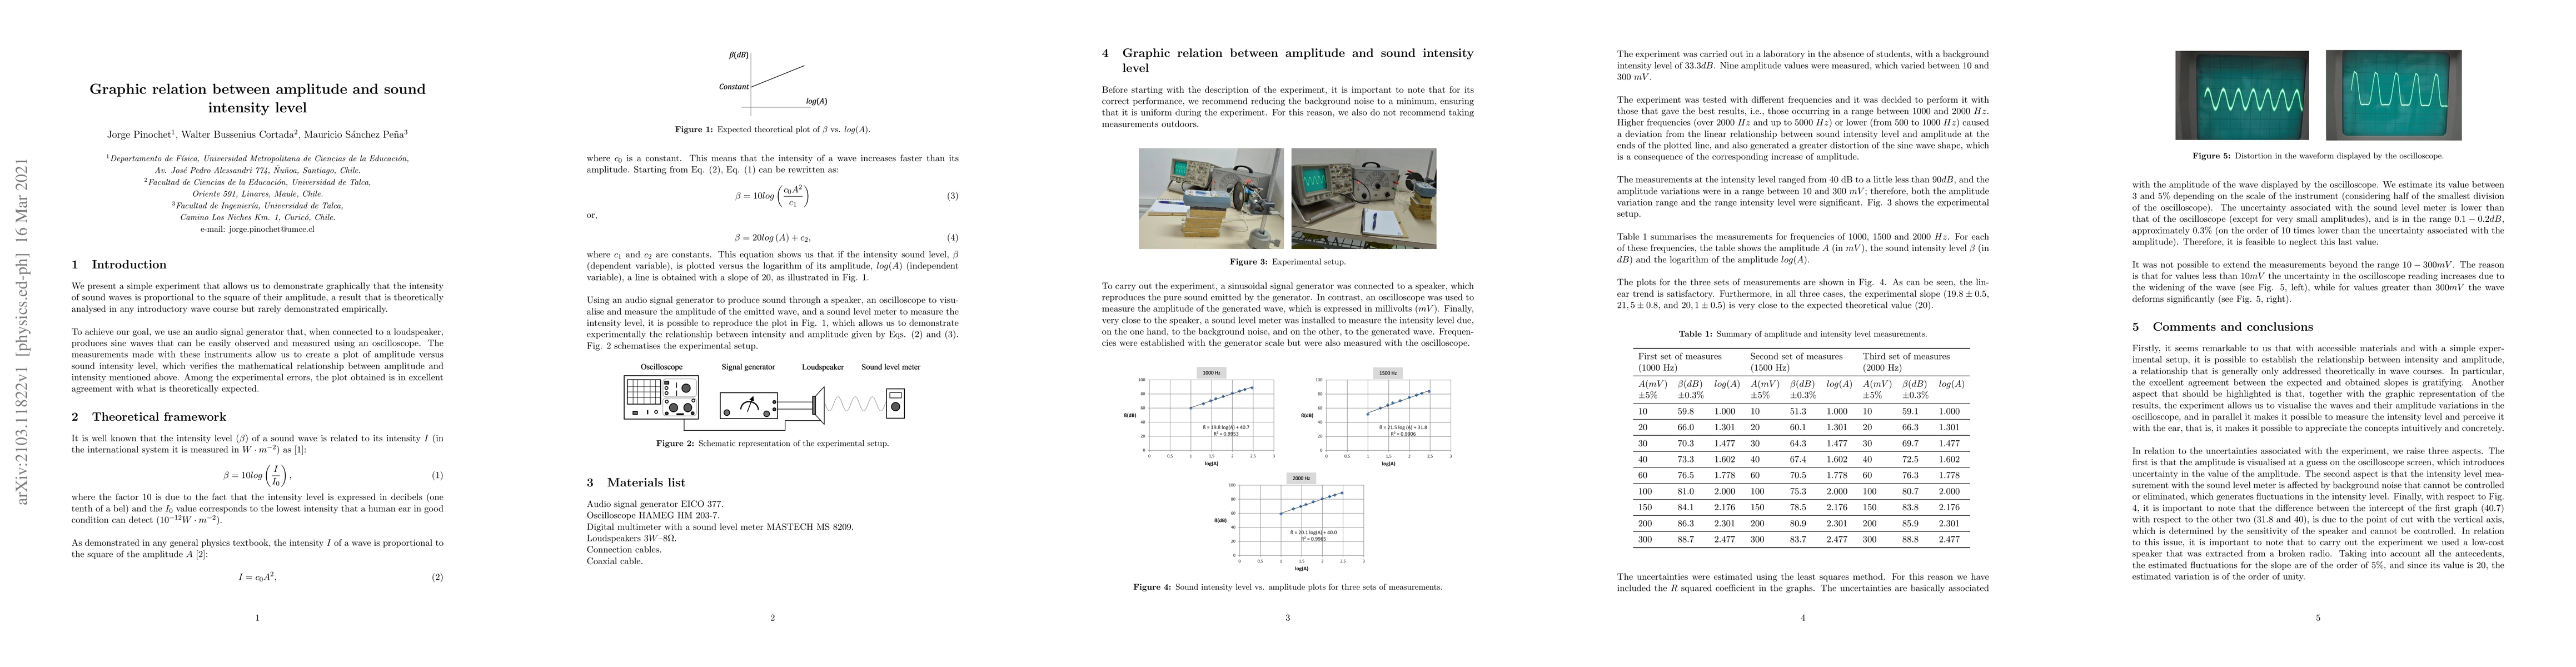
We present a simple experiment that allows us to demonstrate graphically that the intensity of sound waves is proportional to the square of their amplitude, a result that is theoretically analysed in any introductory wave course but rarely demonstrated empirically. To achieve our goal, we use an audio signal generator that, when connected to a loudspeaker, produces sine waves that can be easily observed and measured using an oscilloscope. The measurements made with these instruments allow us to create a plot of amplitude versus sound intensity level, which verifies the mathematical relationship between amplitude and intensity mentioned above. Among the experimental errors, the plot obtained is in excellent agreement with what is theoretically expected.
AI Key Findings
Get AI-generated insights about this paper's methodology, results, significance, and more — seven facets brought into focus.
Impact
Paper Details
Authors
PDF Preview
Key Terms
Citation Network
Current paper (gray), citations (green), references (blue)
Display is limited for performance on very large graphs.
Discussion 0