Graphical tools for detection and control of selection bias with multiple exposures and samples
Publication
Metrics
AI Quick Summary
This paper proposes a graphical framework for detecting and controlling selection bias in studies with multiple exposures and samples, extending the potential outcomes approach to accommodate complex subsample structures and missing data scenarios. It simplifies identification conditions and generalizes to nested or overlapping study samples and time-dependent exposures.
Paper Preview
Abstract
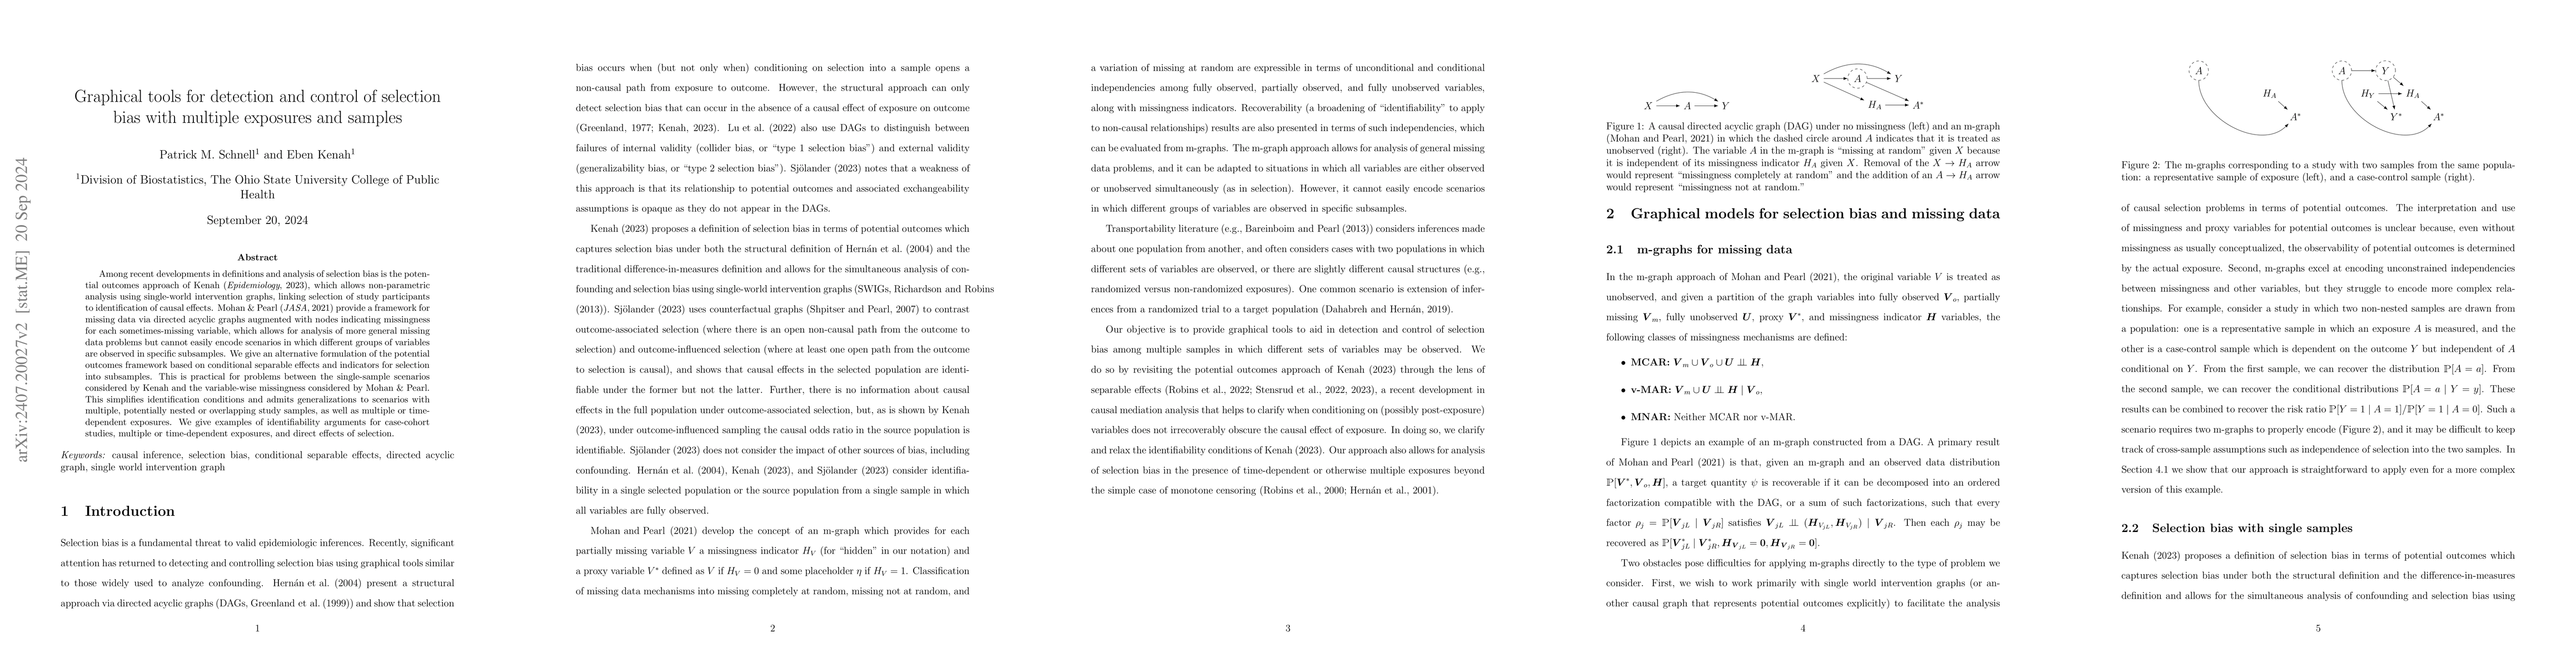
Among recent developments in definitions and analysis of selection bias is the potential outcomes approach of Kenah (Epidemiology, 2023), which allows non-parametric analysis using single-world intervention graphs, linking selection of study participants to identification of causal effects. Mohan & Pearl (JASA, 2021) provide a framework for missing data via directed acyclic graphs augmented with nodes indicating missingness for each sometimes-missing variable, which allows for analysis of more general missing data problems but cannot easily encode scenarios in which different groups of variables are observed in specific subsamples. We give an alternative formulation of the potential outcomes framework based on conditional separable effects and indicators for selection into subsamples. This is practical for problems between the single-sample scenarios considered by Kenah and the variable-wise missingness considered by Mohan & Pearl. This simplifies identification conditions and admits generalizations to scenarios with multiple, potentially nested or overlapping study samples, as well as multiple or time-dependent exposures. We give examples of identifiability arguments for case-cohort studies, multiple or time-dependent exposures, and direct effects of selection.
AI Key Findings
Get AI-generated insights about this paper's methodology, results, significance, and more — seven facets brought into focus.
Impact
Paper Details
Authors
PDF Preview
Citation Network
Current paper (gray), citations (green), references (blue)
Display is limited for performance on very large graphs.
Discussion 0