Hierarchical and Matrix Structures in a Large Organizational Email Network: Visualization and Modeling Approaches
Publication
Metrics
AI Quick Summary
This paper examines the email network of a large scientific research organization, revealing insights into organizational interactions through visualization and modeling. It proposes a power law model to predict email traffic based on hierarchical relationships, highlighting deviations from matrix management ideals.
Paper Preview
Abstract
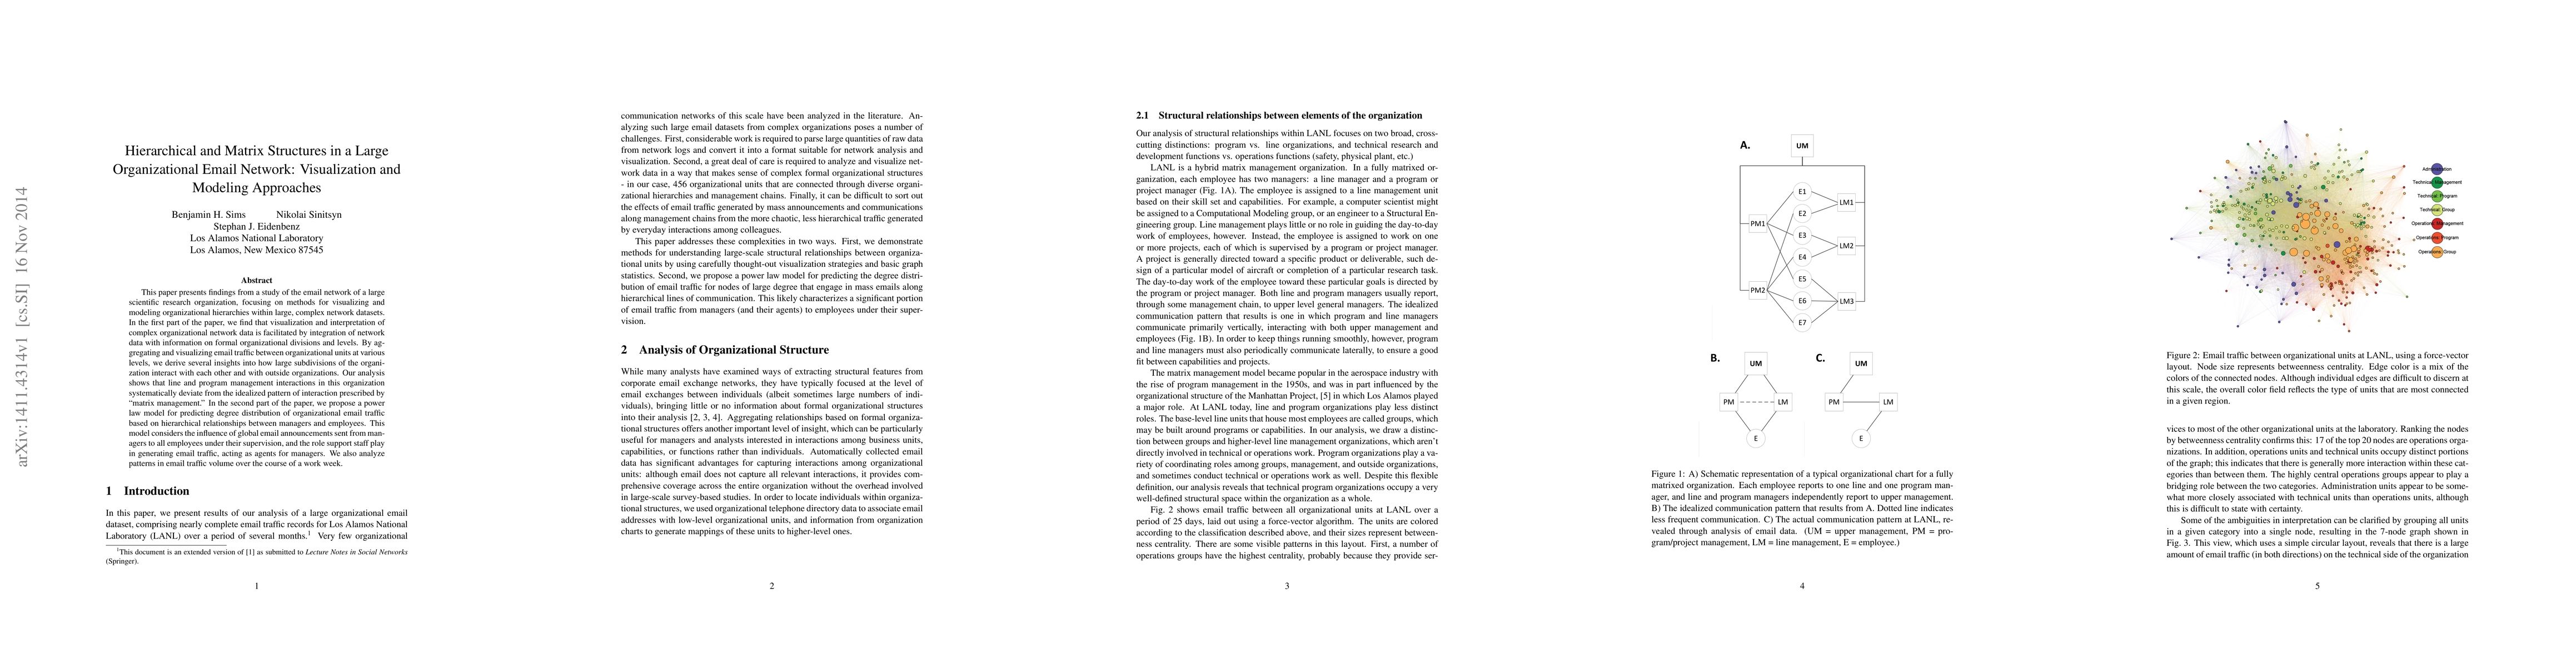
This paper presents findings from a study of the email network of a large scientific research organization, focusing on methods for visualizing and modeling organizational hierarchies within large, complex network datasets. In the first part of the paper, we find that visualization and interpretation of complex organizational network data is facilitated by integration of network data with information on formal organizational divisions and levels. By aggregating and visualizing email traffic between organizational units at various levels, we derive several insights into how large subdivisions of the organization interact with each other and with outside organizations. Our analysis shows that line and program management interactions in this organization systematically deviate from the idealized pattern of interaction prescribed by "matrix management." In the second part of the paper, we propose a power law model for predicting degree distribution of organizational email traffic based on hierarchical relationships between managers and employees. This model considers the influence of global email announcements sent from managers to all employees under their supervision, and the role support staff play in generating email traffic, acting as agents for managers. We also analyze patterns in email traffic volume over the course of a work week.
AI Key Findings
Get AI-generated insights about this paper's methodology, results, significance, and more — seven facets brought into focus.
Impact
Paper Details
PDF Preview
Key Terms
Citation Network
Current paper (gray), citations (green), references (blue)
Display is limited for performance on very large graphs.
Discussion 0