Publication
Metrics
AI Quick Summary
This paper analyzes a corpus of 101 data sketches made by learners, revealing a preference for positional and shape-based encodings, frequent use of symbolic and textual representations, and a common practice of comparing subsets of data. These insights can guide tool design and educational programs for teaching data storytelling.
Paper Preview
Abstract
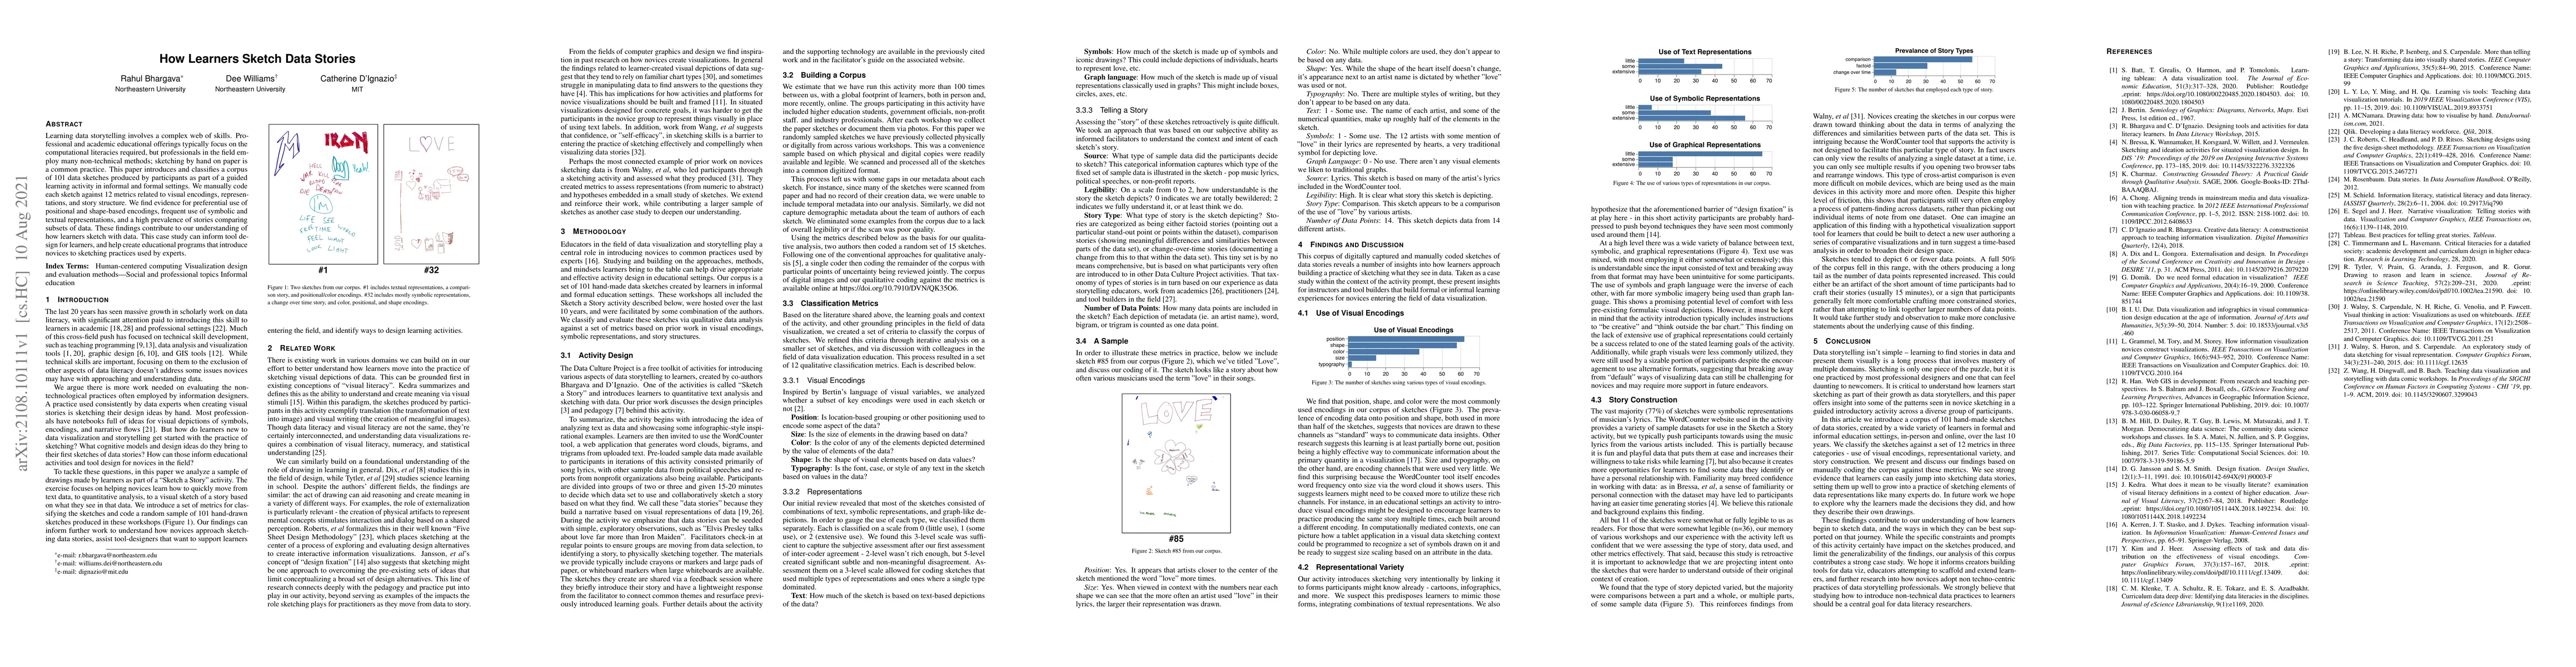
Learning data storytelling involves a complex web of skills. Professional and academic educational offerings typically focus on the computational literacies required, but professionals in the field employ many non-technical methods; sketching by hand on paper is a common practice. This paper introduces and classifies a corpus of 101 data sketches produced by participants as part of a guided learning activity in informal and formal settings. We manually code each sketch against 12 metrics related to visual encodings, representations, and story structure. We find evidence for preferential use of positional and shape-based encodings, frequent use of symbolic and textual representations, and a high prevalence of stories comparing subsets of data. These findings contribute to our understanding of how learners sketch with data. This case study can inform tool design for learners, and help create educational programs that introduce novices to sketching practices used by experts.
AI Key Findings
Get AI-generated insights about this paper's methodology, results, significance, and more — seven facets brought into focus.
Impact
Paper Details
Authors
PDF Preview
Key Terms
Citation Network
Current paper (gray), citations (green), references (blue)
Display is limited for performance on very large graphs.
Discussion 0