How to predict and optimise with asymmetric error metrics
Publication
Metrics
AI Quick Summary
This paper explores the predict and optimise problem in forecasting building energy use and solar generation, emphasizing the impact of asymmetric error metrics on optimisation costs. It proposes adjusting loss functions to better align predictions with optimisation, demonstrating that improved forecasting can lead to lower optimisation costs.
Paper Preview
Abstract
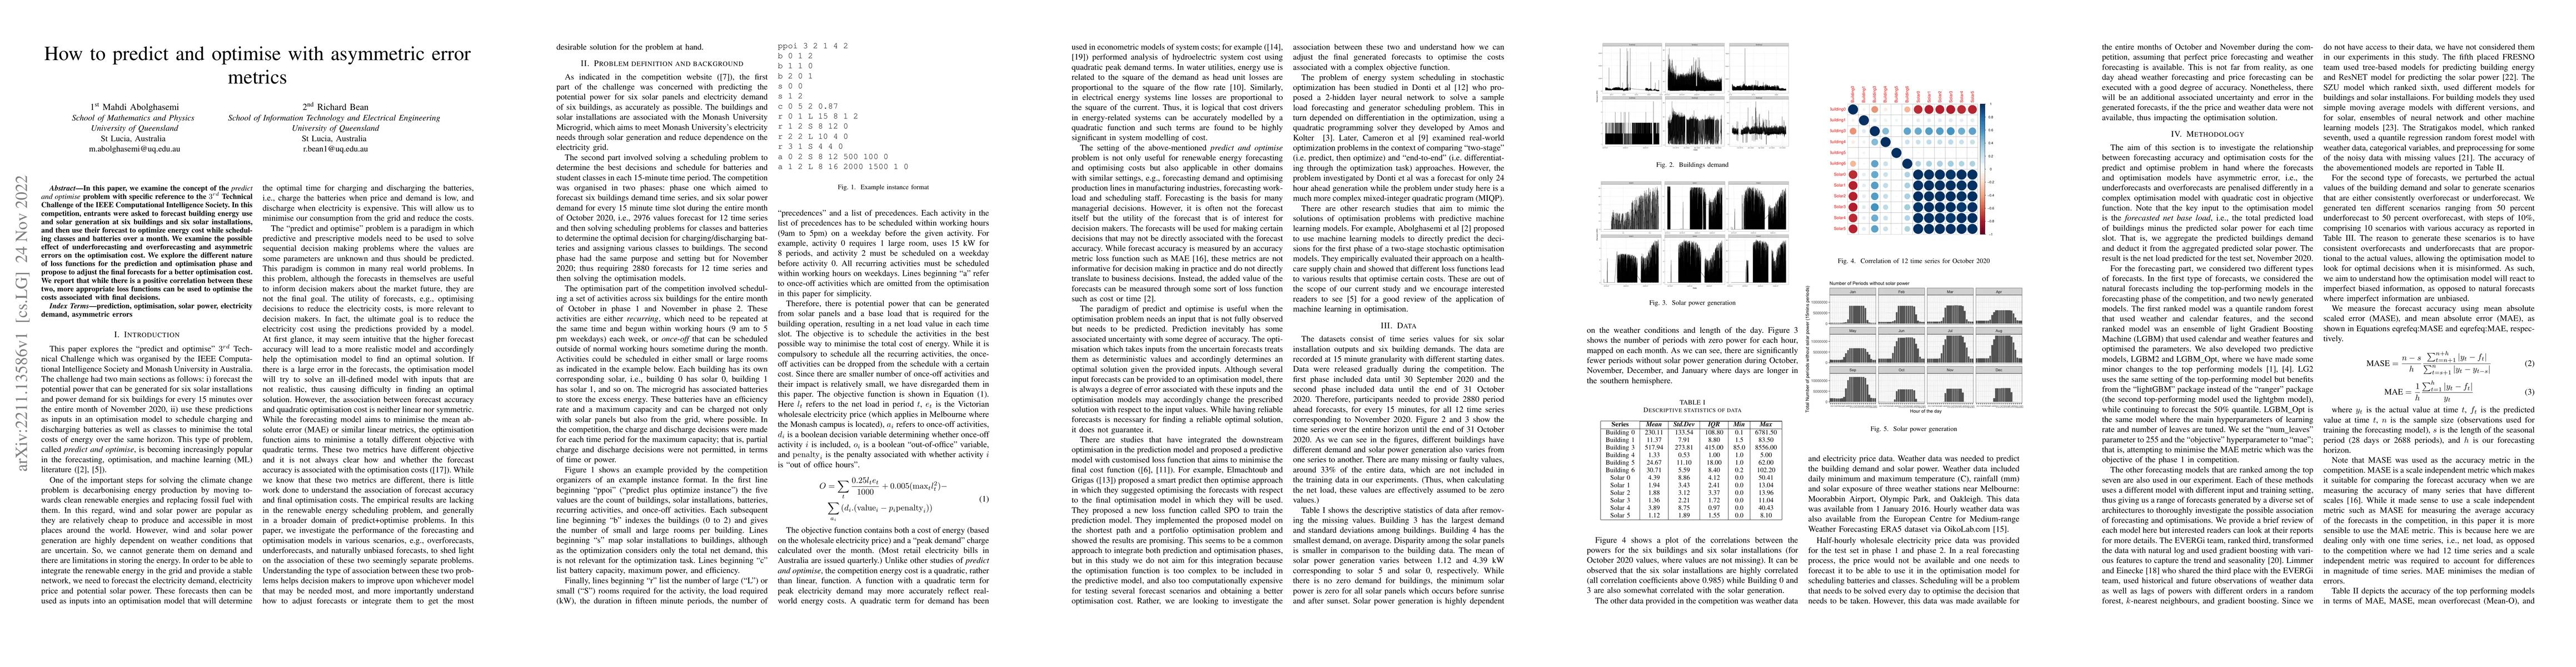
In this paper, we examine the concept of the predict and optimise problem with specific reference to the third Technical Challenge of the IEEE Computational Intelligence Society. In this competition, entrants were asked to forecast building energy use and solar generation at six buildings and six solar installations, and then use their forecast to optimize energy cost while scheduling classes and batteries over a month. We examine the possible effect of underforecasting and overforecasting and asymmetric errors on the optimisation cost. We explore the different nature of loss functions for the prediction and optimisation phase and propose to adjust the final forecasts for a better optimisation cost. We report that while there is a positive correlation between these two, more appropriate loss functions can be used to optimise the costs associated with final decisions.
AI Key Findings
Get AI-generated insights about this paper's methodology, results, significance, and more — seven facets brought into focus.
Impact
Paper Details
Authors
PDF Preview
Key Terms
Citation Network
Current paper (gray), citations (green), references (blue)
Display is limited for performance on very large graphs.
Discussion 0