Identifying Influential Pandemic Regions Using Graph Signal Variation
Publication
Metrics
AI Quick Summary
This paper proposes graph signal-based metrics to identify regions with a high influence on the spread of pandemics by analyzing population movement across regions. The study introduces local variation and temporal local variation metrics, demonstrating their effectiveness in pinpointing influential regions compared to global graph-based methods.
Paper Preview
Abstract
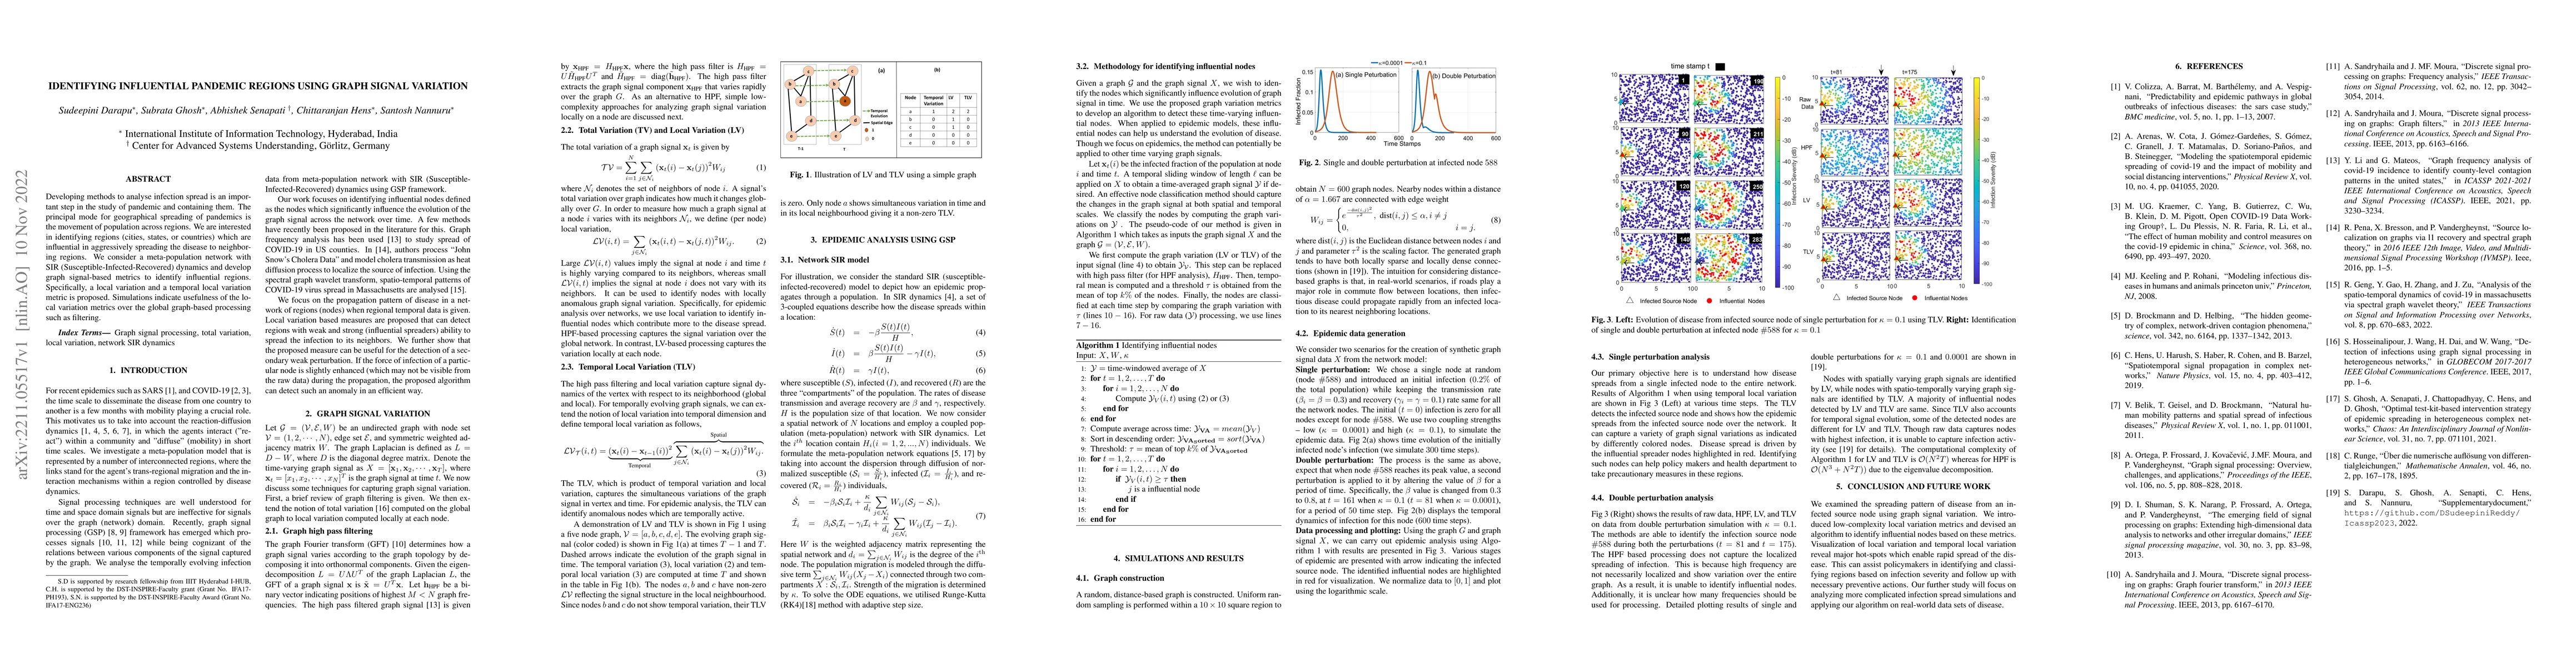
Developing methods to analyse infection spread is an important step in the study of pandemic and containing them. The principal mode for geographical spreading of pandemics is the movement of population across regions. We are interested in identifying regions (cities, states, or countries) which are influential in aggressively spreading the disease to neighboring regions. We consider a meta-population network with SIR (Susceptible-Infected-Recovered) dynamics and develop graph signal-based metrics to identify influential regions. Specifically, a local variation and a temporal local variation metric is proposed. Simulations indicate usefulness of the local variation metrics over the global graph-based processing such as filtering.
AI Key Findings
Get AI-generated insights about this paper's methodology, results, significance, and more — seven facets brought into focus.
Impact
Paper Details
Authors
PDF Preview
Key Terms
Citation Network
Current paper (gray), citations (green), references (blue)
Display is limited for performance on very large graphs.
Discussion 0