Improve Sensitivity Analysis Synthesizing Randomized Clinical Trials With Limited Overlap
Publication
Metrics
AI Quick Summary
This paper proposes a novel synthesis estimator to enhance sensitivity analysis in observational studies by integrating data from randomized clinical trials (RCTs), even when overlap in covariate distributions is limited. The method provides tighter bounds under a "separability" condition, as demonstrated through theoretical proofs and simulations, ultimately improving estimates of average treatment effects.
Paper Preview
Abstract
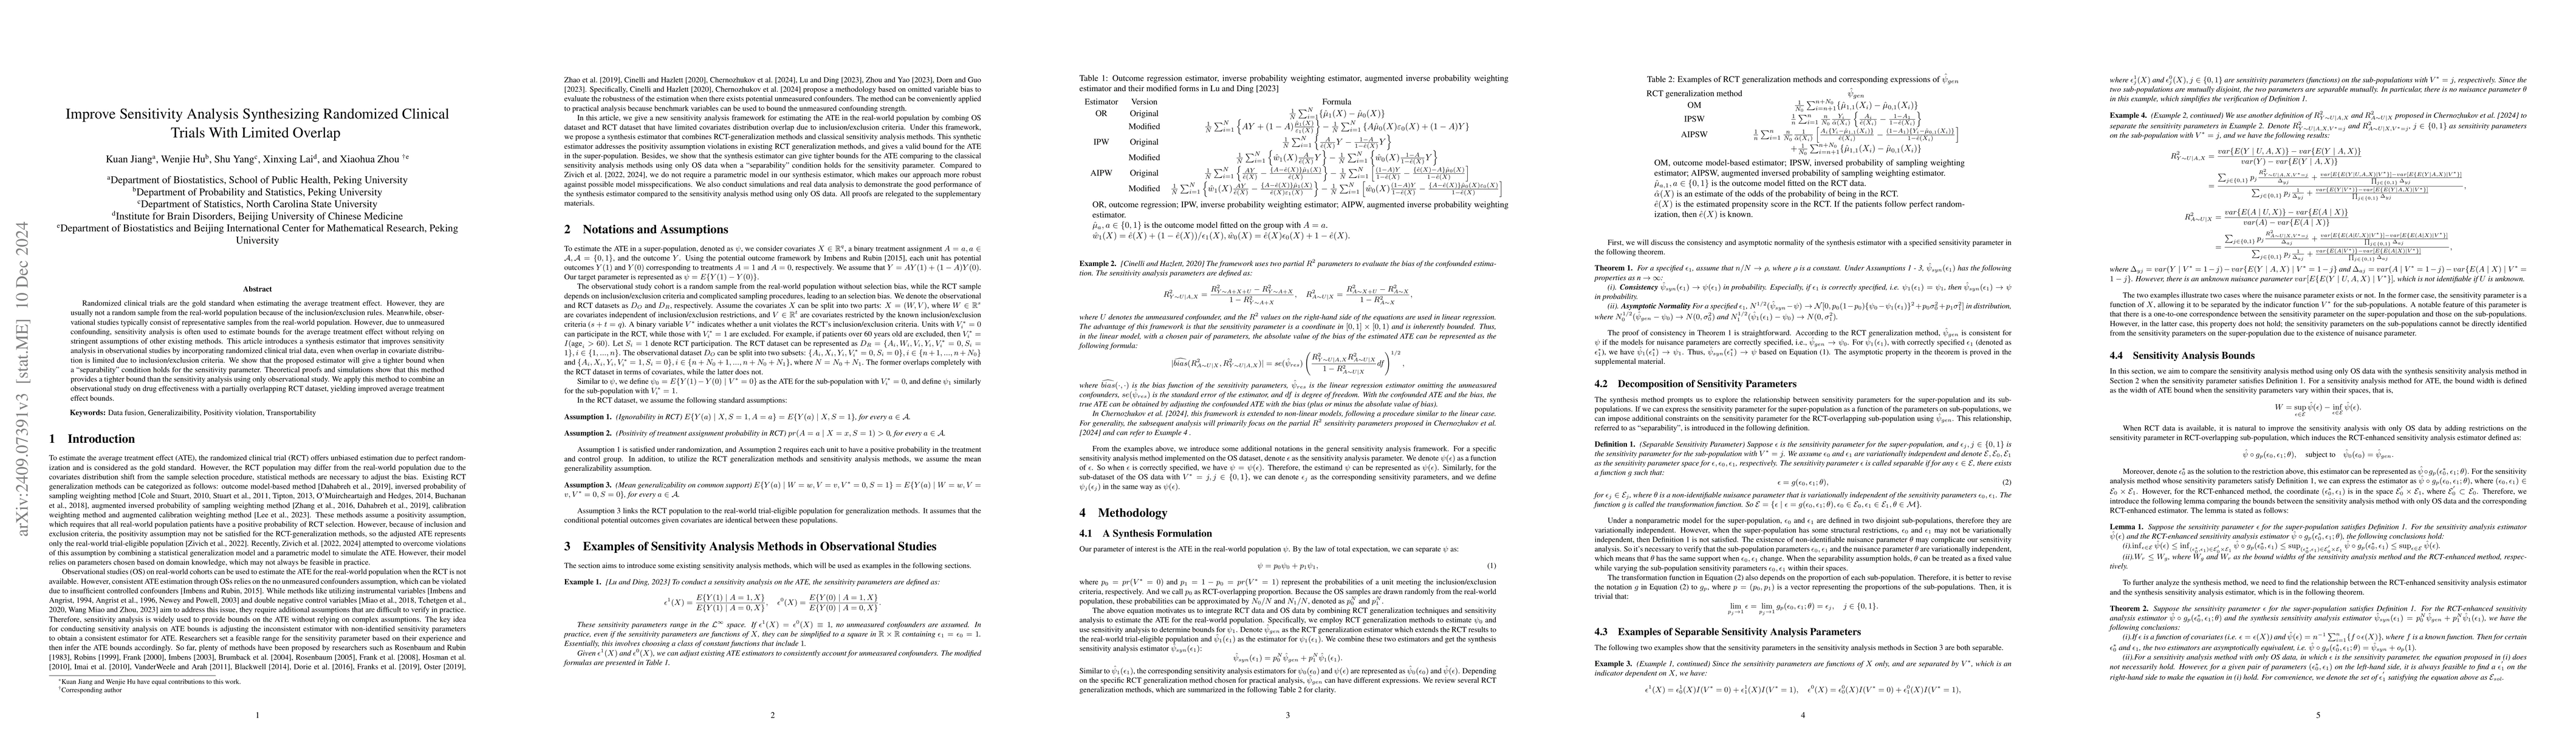
Randomized clinical trials are the gold standard when estimating the average treatment effect. However, they are usually not a random sample from the real-world population because of the inclusion/exclusion rules. Meanwhile, observational studies typically consist of representative samples from the real-world population. However, due to unmeasured confounding, sensitivity analysis is often used to estimate bounds for the average treatment effect without relying on stringent assumptions of other existing methods. This article introduces a synthesis estimator that improves sensitivity analysis in observational studies by incorporating randomized clinical trial data, even when overlap in covariate distribution is limited due to inclusion/exclusion criteria. We show that the proposed estimator will give a tighter bound when a "separability" condition holds for the sensitivity parameter. Theoretical proofs and simulations show that this method provides a tighter bound than the sensitivity analysis using only observational study. We apply this method to combine an observational study on drug effectiveness with a partially overlapping RCT dataset, yielding improved average treatment effect bounds.
AI Key Findings
Get AI-generated insights about this paper's methodology, results, significance, and more — seven facets brought into focus.
Impact
Authors
PDF Preview
Citation Network
Current paper (gray), citations (green), references (blue)
Display is limited for performance on very large graphs.
Discussion 0