Improving the Projection of Global Structures in Data through Spanning Trees
Publication
Metrics
Paper Preview
Abstract
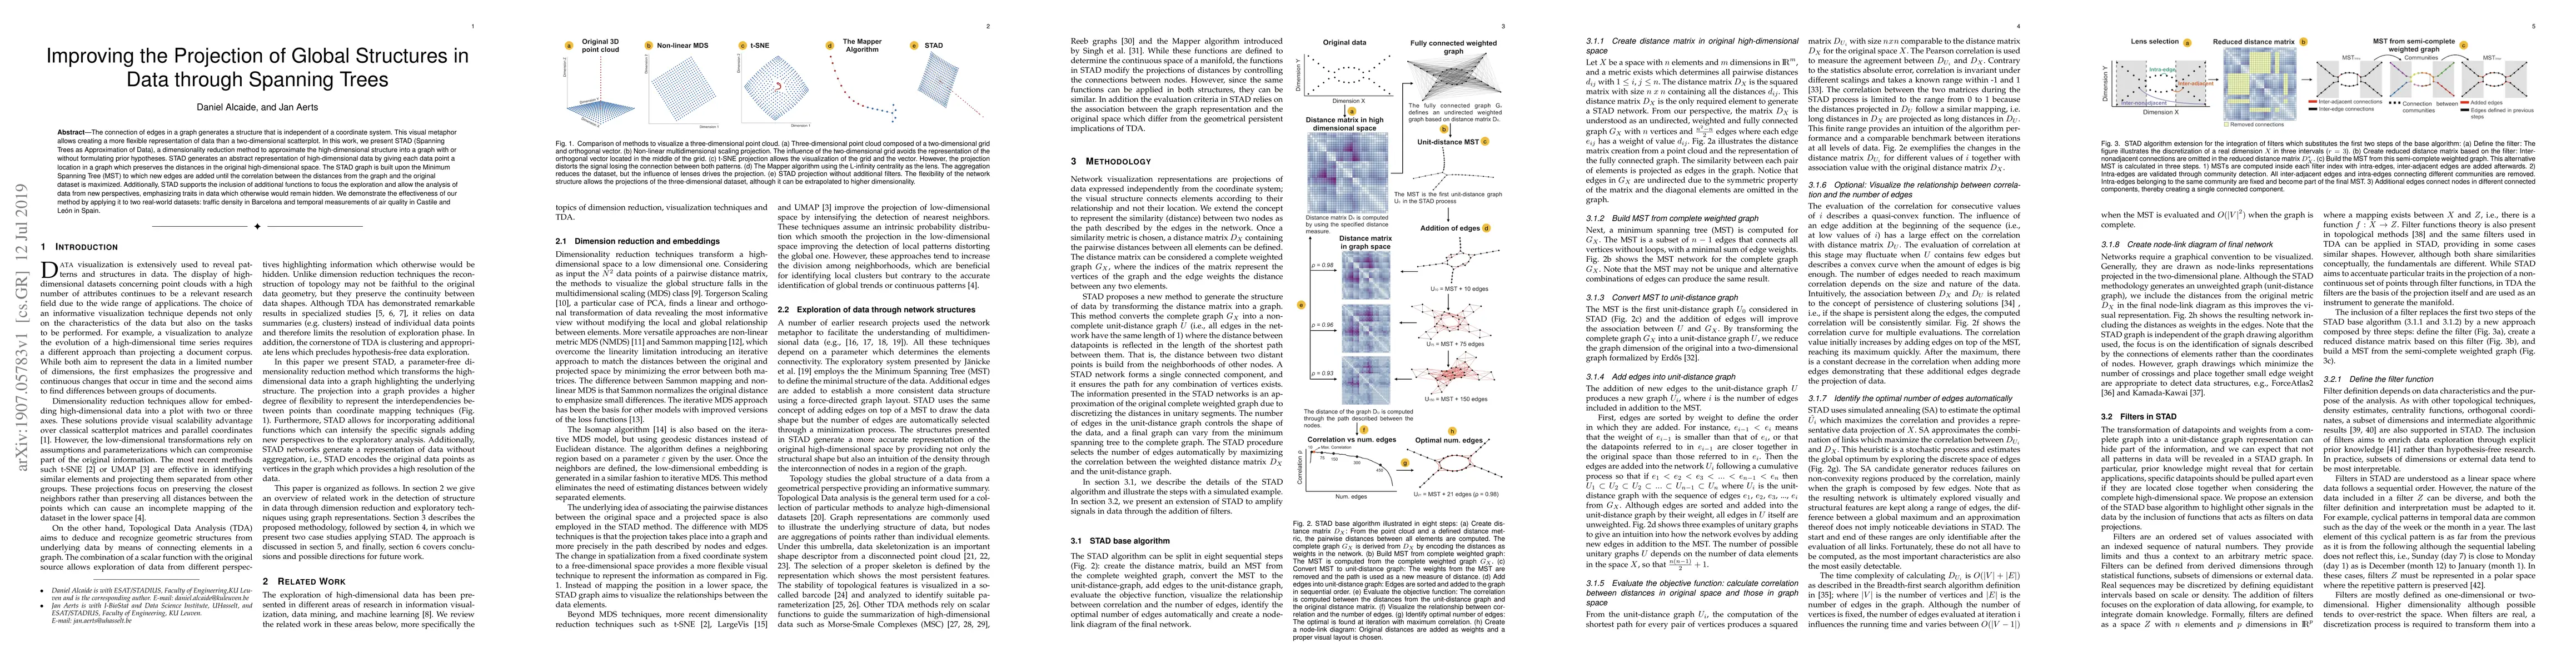
The connection of edges in a graph generates a structure that is independent of a coordinate system. This visual metaphor allows creating a more flexible representation of data than a two-dimensional scatterplot. In this work, we present STAD (Spanning Trees as Approximation of Data), a dimensionality reduction method to approximate the high-dimensional structure into a graph with or without formulating prior hypotheses. STAD generates an abstract representation of high-dimensional data by giving each data point a location in a graph which preserves the distances in the original high-dimensional space. The STAD graph is built upon the Minimum Spanning Tree (MST) to which new edges are added until the correlation between the distances from the graph and the original dataset is maximized. Additionally, STAD supports the inclusion of additional functions to focus the exploration and allow the analysis of data from new perspectives, emphasizing traits in data which otherwise would remain hidden. We demonstrate the effectiveness of our method by applying it to two real-world datasets: traffic density in Barcelona and temporal measurements of air quality in Castile and Le\'on in Spain.
AI Key Findings
Get AI-generated insights about this paper's methodology, results, significance, and more — seven facets brought into focus.
Impact
Paper Details
PDF Preview
Key Terms
Citation Network
Current paper (gray), citations (green), references (blue)
Display is limited for performance on very large graphs.
Discussion 0