Investigating the causal effects of multiple treatments using longitudinal data: a simulation study
Publication
Metrics
AI Quick Summary
This study investigates the causal effects of multiple treatments using longitudinal data through a simulation study, comparing five generalized g-methods (including marginal structural models and g-formula) for handling time-dependent confounding and multiple treatments, and applies these methods to data from the UK Cystic Fibrosis Registry.
Paper Preview
Abstract
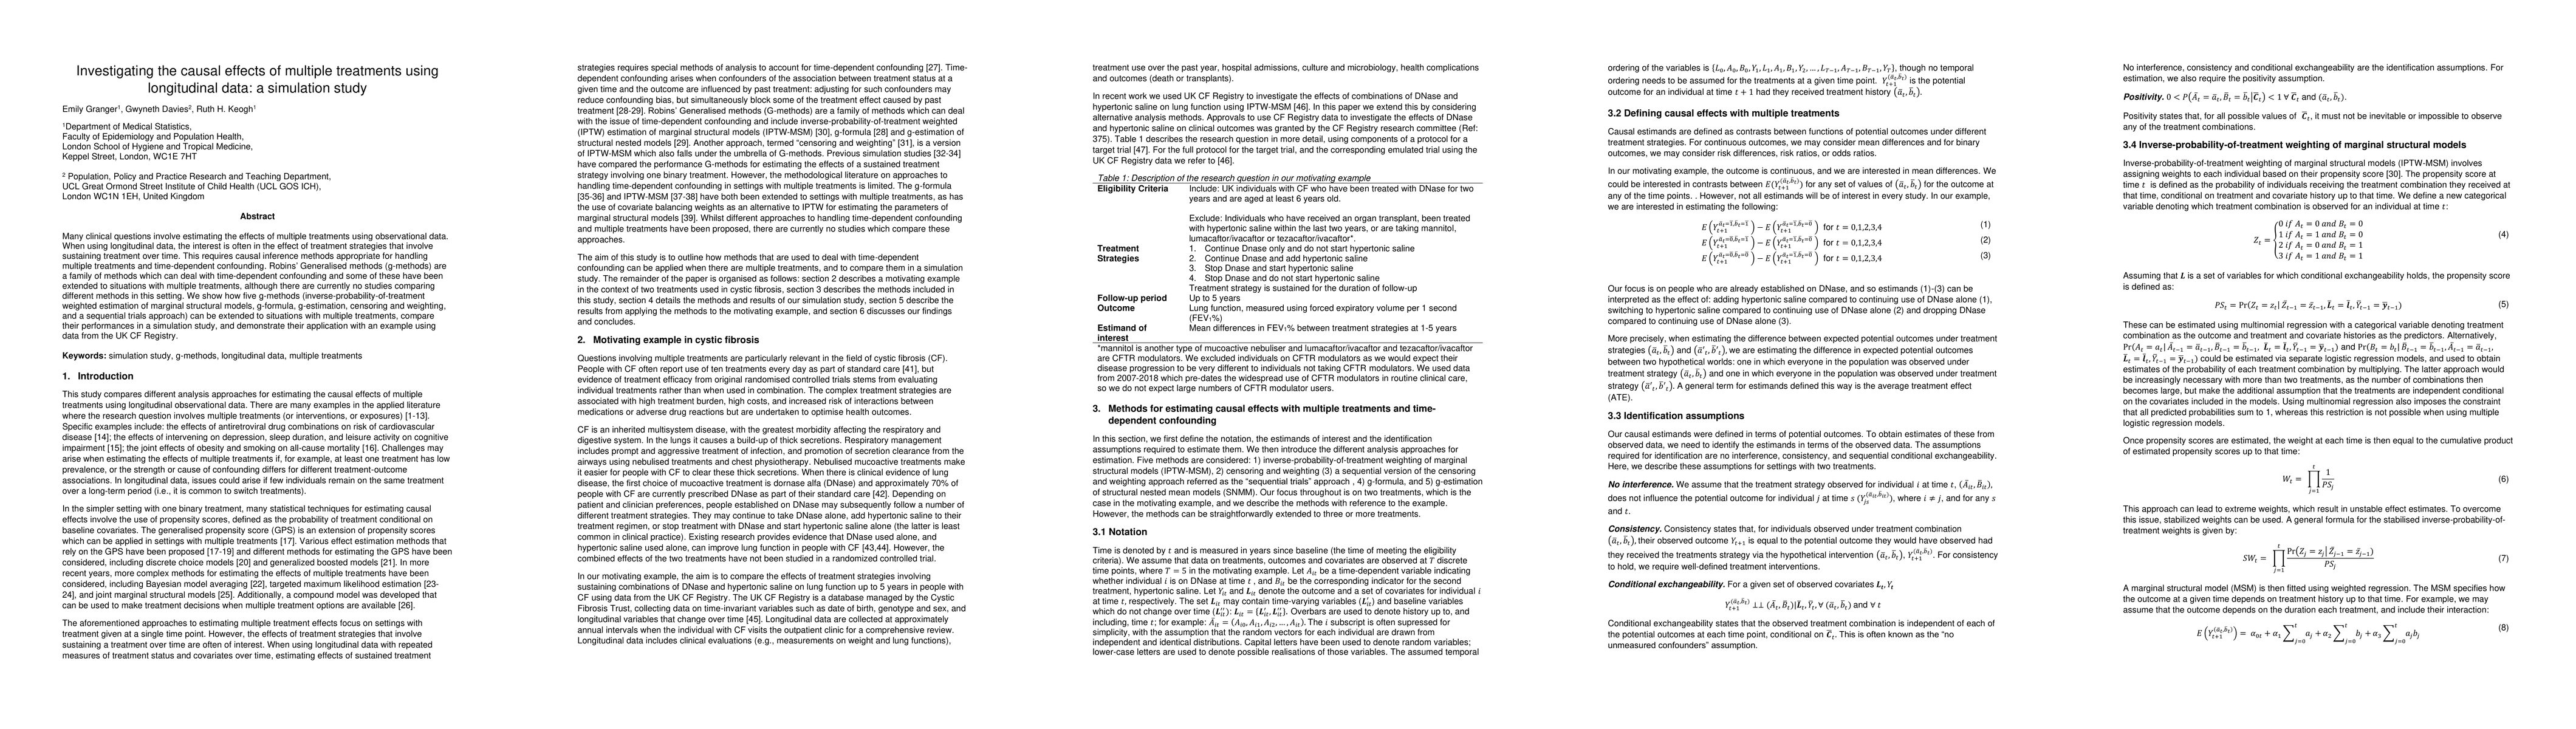
Many clinical questions involve estimating the effects of multiple treatments using observational data. When using longitudinal data, the interest is often in the effect of treatment strategies that involve sustaining treatment over time. This requires causal inference methods appropriate for handling multiple treatments and time-dependent confounding. Robins Generalised methods (g-methods) are a family of methods which can deal with time-dependent confounding and some of these have been extended to situations with multiple treatments, although there are currently no studies comparing different methods in this setting. We show how five g-methods (inverse-probability-of-treatment weighted estimation of marginal structural models, g-formula, g-estimation, censoring and weighting, and a sequential trials approach) can be extended to situations with multiple treatments, compare their performances in a simulation study, and demonstrate their application with an example using data from the UK CF Registry.
AI Key Findings
Get AI-generated insights about this paper's methodology, results, significance, and more — seven facets brought into focus.
Impact
Paper Details
Authors
PDF Preview
Key Terms
Citation Network
Current paper (gray), citations (green), references (blue)
Display is limited for performance on very large graphs.
Discussion 0