ChartCF introduces a counterfactual supervision framework for chart understanding by (i) synthesizing counterfactual chart pairs through code modifications that preserve appearance while changing ground-truth answers, (ii) applying a chart similarity-based data selection to filter overly difficult samples, and (iii) performing multimodal preference optimization (TextDPO and ImageDPO) to align answers with the presented chart across both textual and visual modalities.
Learning More from Less: Exploiting Counterfactuals for Data-Efficient Chart Understanding
Publication
Metrics
AI Quick Summary
ChartCF is a data-efficient training approach that improves chart understanding by teaching vision-language models to recognize small, code-driven visual changes that alter meaning. It uses (1) counterfactual data generation via code edits, (2) selective sample filtering by chart similarity, and (3) joint text- and image-based preference optimization, achieving strong results with much less training data across five benchmarks.
Quick Answers
What is "Learning More from Less: Exploiting Counterfactuals for Data-Efficient Chart Understanding" about?
ChartCF is a data-efficient training approach that improves chart understanding by teaching vision-language models to recognize small, code-driven visual changes that alter meaning. It uses (1) counterfactual data generation via code edits, (2) selective sample filtering by chart similarity, and (3) joint text- and image-based preference optimization, achieving strong results with much less training data across five benchmarks.
What methodology did the authors use?
ChartCF introduces a counterfactual supervision framework for chart understanding by (i) synthesizing counterfactual chart pairs through code modifications that preserve appearance while changing ground-truth answers, (ii) applying a chart similarity-based data selection to filter overly difficult samples, and (iii) performing multimodal preference optimization (TextDPO and ImageDPO) to align answers with the presented chart across both textual and visual modalities. More in Methodology →
What are the key results?
ChartCF achieves superior or comparable performance to strong chart-specific VLMs on five benchmarks while using significantly less training data. — Compared to the ECD baseline trained on 300K samples, ChartCF reaches similar performance with only 4K preference pairs, illustrating high data efficiency. More in Key Results →
Why is this work significant?
The work demonstrates that counterfactual supervision and multimodal preference optimization can dramatically reduce data requirements for chart understanding, addressing a key limitation of SFT-heavy approaches and enabling more efficient, robust VLMs for data-analytic charts. More in Significance →
What are the main limitations?
Evaluation is limited to five benchmarks; broader generalization to unseen chart styles or domains remains untested. — Dependence on high-quality synthetic datasets and code-based rendering tools may affect transferability to real-world, noisy charts. More in Limitations →
Abstract
Vision-Language Models (VLMs) have demonstrated remarkable progress in chart understanding, largely driven by supervised fine-tuning (SFT) on increasingly large synthetic datasets. However, scaling SFT data alone is inefficient and overlooks a key property of charts: charts are programmatically generated visual artifacts, where small, code-controlled visual changes can induce drastic shifts in semantics and correct answers. Learning this counterfactual sensitivity requires VLMs to discriminate fine-grained visual differences, yet standard SFT treats training instances independently and provides limited supervision to enforce this behavior. To address this, we introduce ChartCF, a data-efficient training framework designed to enhance counterfactual sensitivity. ChartCF consists of: (1) a counterfactual data synthesis pipeline via code modification, (2) a chart similarity-based data selection strategy that filters overly difficult samples for improved training efficiency, and (3) multimodal preference optimization across both textual and visual modalities. Experiments on five benchmarks show that ChartCF achieves superior or comparable performance to strong chart-specific VLMs while using significantly less training data.
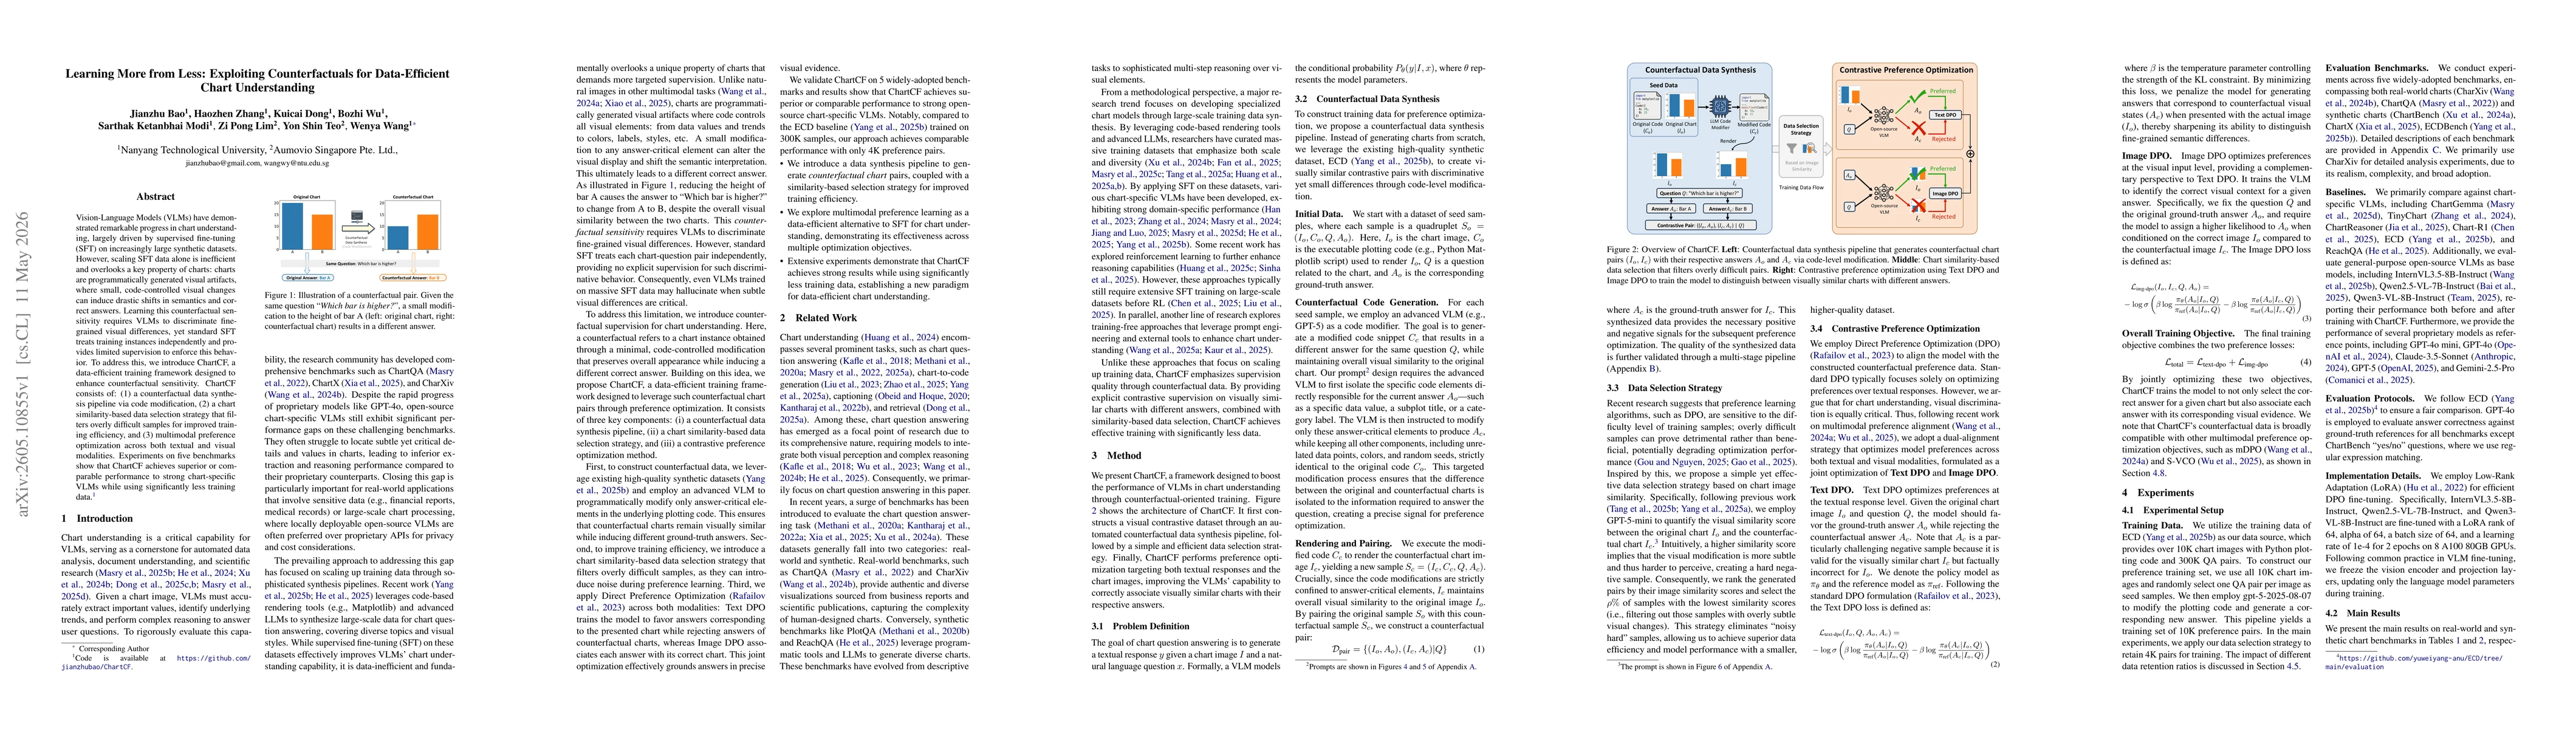
Key Findings, in focus
Seven facets of this paper, analysed and brought into focus by AI.
The work demonstrates that counterfactual supervision and multimodal preference optimization can dramatically reduce data requirements for chart understanding, addressing a key limitation of SFT-heavy approaches and enabling more efficient, robust VLMs for data-analytic charts.
- ChartCF achieves superior or comparable performance to strong chart-specific VLMs on five benchmarks while using significantly less training data.
- Compared to the ECD baseline trained on 300K samples, ChartCF reaches similar performance with only 4K preference pairs, illustrating high data efficiency.
The work demonstrates that counterfactual supervision and multimodal preference optimization can dramatically reduce data requirements for chart understanding, addressing a key limitation of SFT-heavy approaches and enabling more efficient, robust VLMs for data-analytic charts.
A data-efficient training framework (ChartCF) that (a) generates counterfactual chart pairs via minimal code changes, (b) selects training samples using chart similarity to avoid overly hard cases, and (c) optimizes cross-modal preferences (TextDPO and ImageDPO) to ground answers in precise visual evidence.
First to fuse counterfactual data synthesis with similarity-based sample filtering and multimodal preference optimization for data-efficient chart understanding, achieving strong results with substantially reduced training data.
- Evaluation is limited to five benchmarks; broader generalization to unseen chart styles or domains remains untested.
- Dependence on high-quality synthetic datasets and code-based rendering tools may affect transferability to real-world, noisy charts.
- Explore scaling ChartCF to more diverse chart families and complex visual encodings.
- Investigate automatic augmentation of counterfactuals and alternative preference objectives to further improve data efficiency.
- Assess real-time inference performance and deployment considerations for chart understanding in production systems.
Discussion 0