Log Complex Color for Visual Pattern Recognition of Total Sound
Publication
Metrics
Paper Preview
Abstract
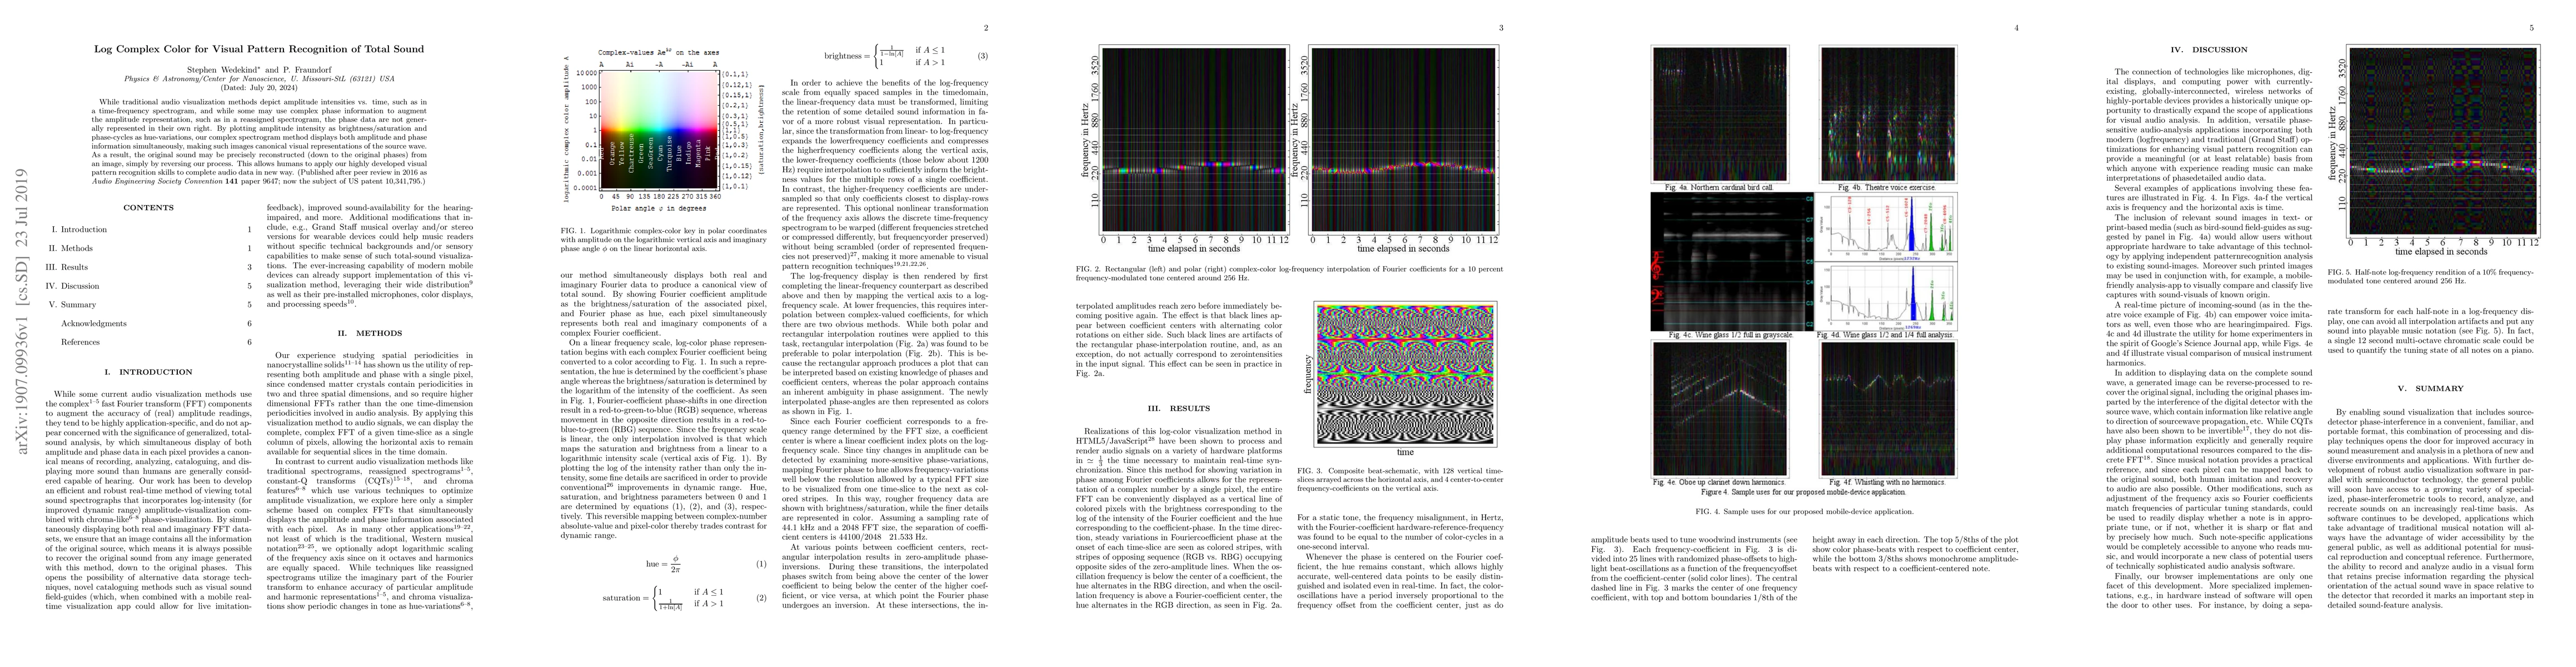
While traditional audio visualization methods depict amplitude intensities vs. time, such as in a time-frequency spectrogram, and while some may use complex phase information to augment the amplitude representation, such as in a reassigned spectrogram, the phase data are not generally represented in their own right. By plotting amplitude intensity as brightness/saturation and phase-cycles as hue-variations, our complex spectrogram method displays both amplitude and phase information simultaneously, making such images canonical visual representations of the source wave. As a result, the original sound may be precisely reconstructed (down to the original phases) from an image, simply by reversing our process. This allows humans to apply our highly developed visual pattern recognition skills to complete audio data in new way.
AI Key Findings
Get AI-generated insights about this paper's methodology, results, significance, and more — seven facets brought into focus.
Impact
Paper Details
PDF Preview
Key Terms
Citation Network
Current paper (gray), citations (green), references (blue)
Display is limited for performance on very large graphs.
Discussion 0