Long-term, Short-term and Sudden Event: Trading Volume Movement Prediction with Graph-based Multi-view Modeling
Publication
Metrics
AI Quick Summary
Researchers propose a graph-based approach to predict trading volume movement, incorporating long-term trends, short-term fluctuations, and sudden events into a single model, achieving better performance than existing methods.
Paper Preview
Abstract
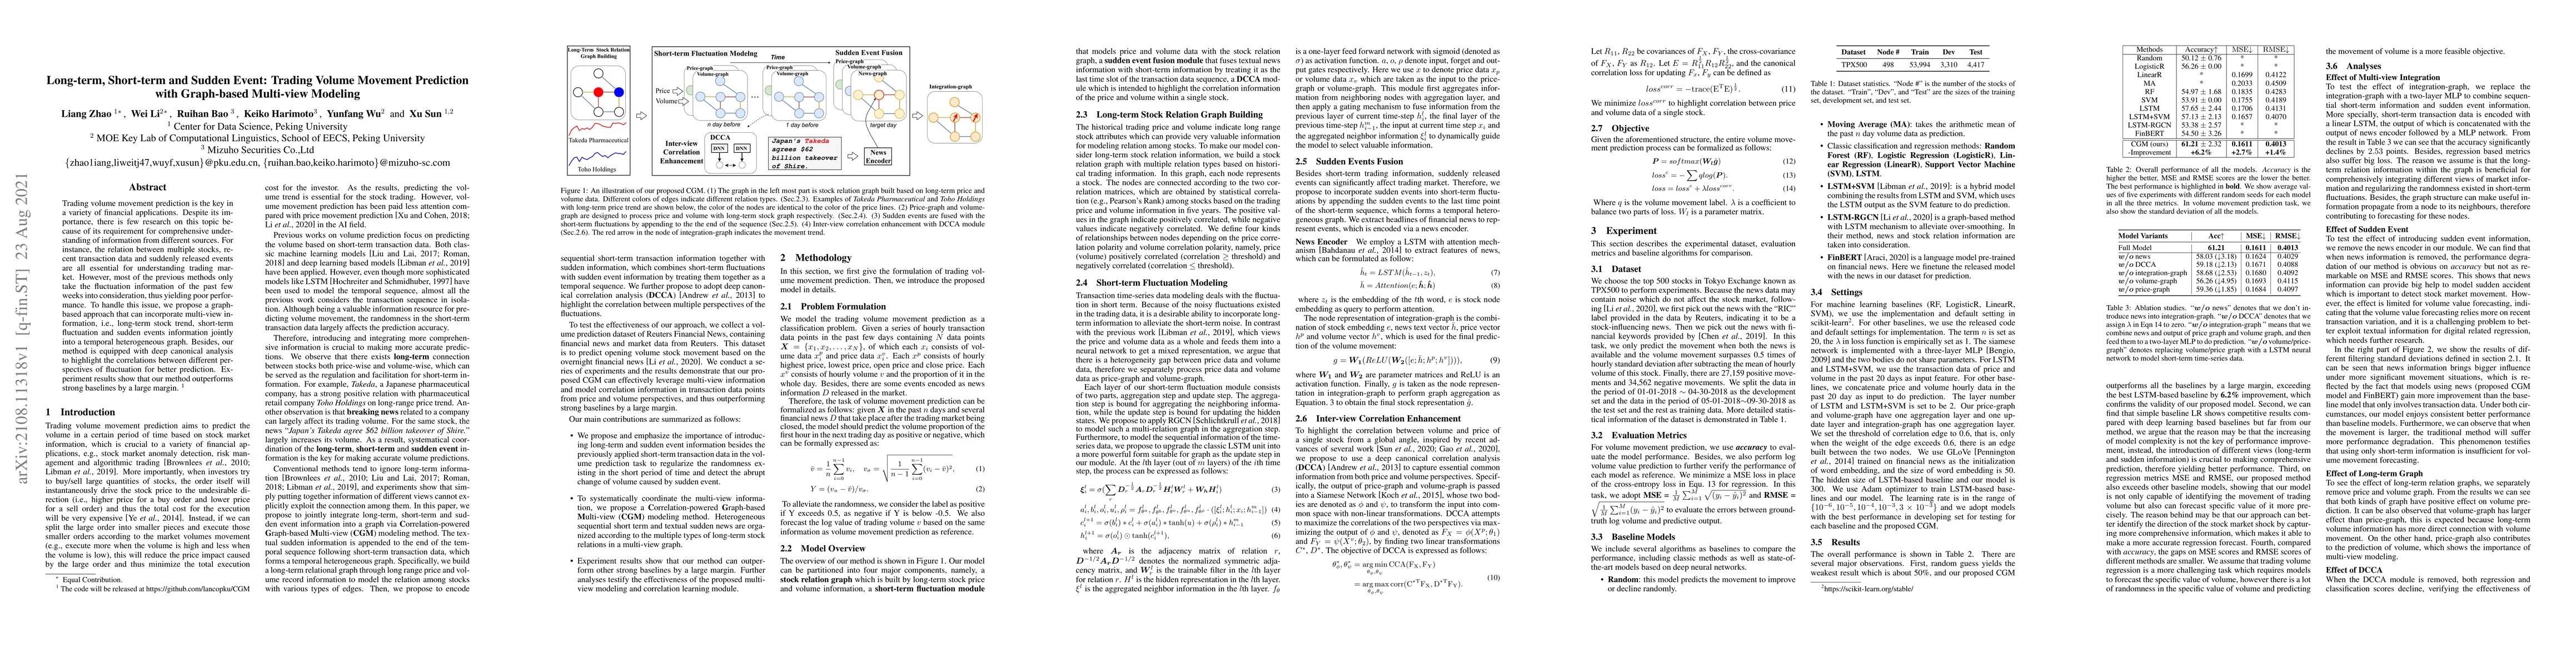
Trading volume movement prediction is the key in a variety of financial applications. Despite its importance, there is few research on this topic because of its requirement for comprehensive understanding of information from different sources. For instance, the relation between multiple stocks, recent transaction data and suddenly released events are all essential for understanding trading market. However, most of the previous methods only take the fluctuation information of the past few weeks into consideration, thus yielding poor performance. To handle this issue, we propose a graphbased approach that can incorporate multi-view information, i.e., long-term stock trend, short-term fluctuation and sudden events information jointly into a temporal heterogeneous graph. Besides, our method is equipped with deep canonical analysis to highlight the correlations between different perspectives of fluctuation for better prediction. Experiment results show that our method outperforms strong baselines by a large margin.
AI Key Findings
Get AI-generated insights about this paper's methodology, results, significance, and more — seven facets brought into focus.
Impact
Paper Details
Authors
PDF Preview
Key Terms
Citation Network
Current paper (gray), citations (green), references (blue)
Display is limited for performance on very large graphs.
Discussion 0