Mathematical model for resistance and optimal strategy
Publication
Metrics
AI Quick Summary
A mathematical model is proposed to analyze price movements when hitting a resistance level, finding an optimal strategy for risk management using simulations.
Paper Preview
Abstract
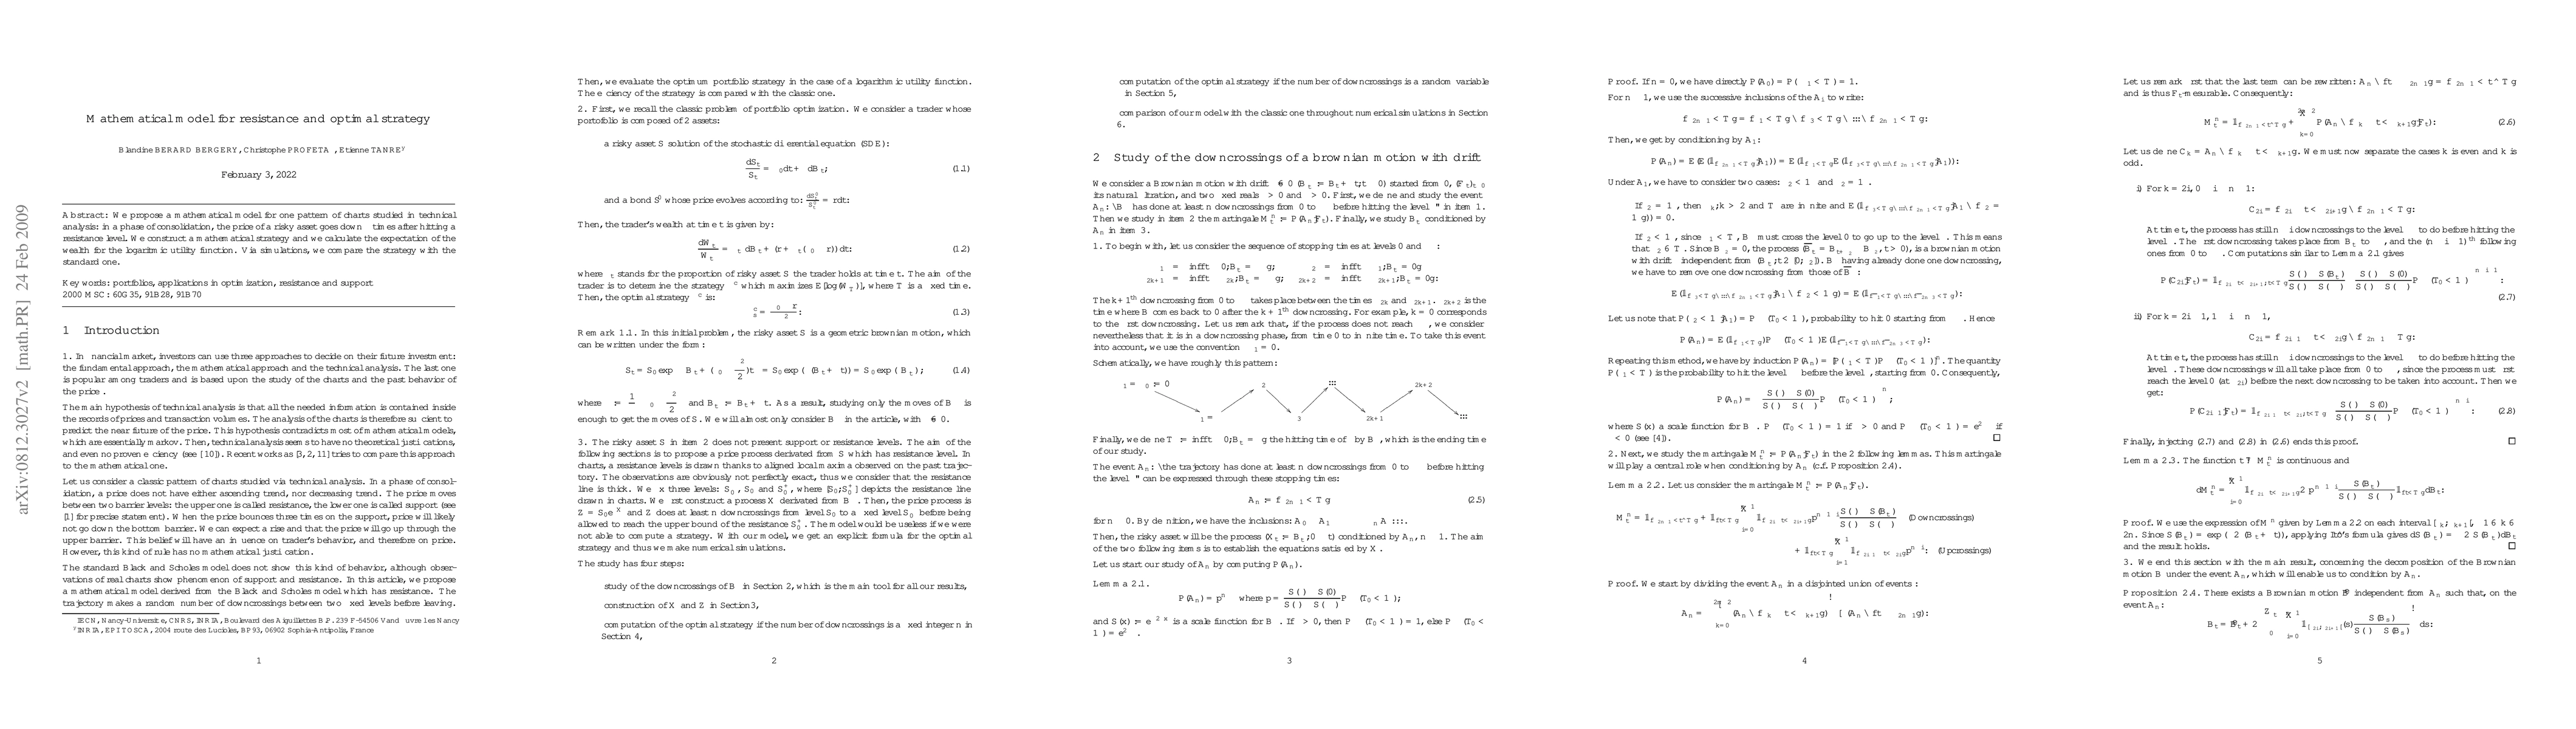
We propose a mathematical model for one pattern of charts studied in technical analysis: in a phase of consolidation, the price of a risky asset goes down $\xi$ times after hitting a resistance level. We construct a mathematical strategy and we calculate the expectation of the wealth for the logaritmic utility function. Via simulations, we compare the strategy with the standard one.
AI Key Findings
Get AI-generated insights about this paper's methodology, results, significance, and more — seven facets brought into focus.
Impact
Paper Details
PDF Preview
Key Terms
Citation Network
Current paper (gray), citations (green), references (blue)
Display is limited for performance on very large graphs.
Discussion 0