01
MethodologyHow they did it
A network analysis approach was used to identify patterns in human mobility data
This paper analyzes human mobility patterns in the UK using Facebook Movement Maps, revealing multiscale community structures that better reflect intrinsic mobility scales than administrative regions. It shows how mobility reverted to fine-scale communities during lockdown and expanded back to coarser scales as restrictions eased, quantified by a linear decay shock model.
This paper analyzes human mobility patterns in the UK using Facebook Movement Maps, revealing multiscale community structures that better reflect intrinsic mobility scales than administrative regions. It shows how mobility reverted to fine-scale communities during lockdown and expanded back to coarser scales as restrictions eased, quantified by a linear decay shock model.
A network analysis approach was used to identify patterns in human mobility data More in Methodology →
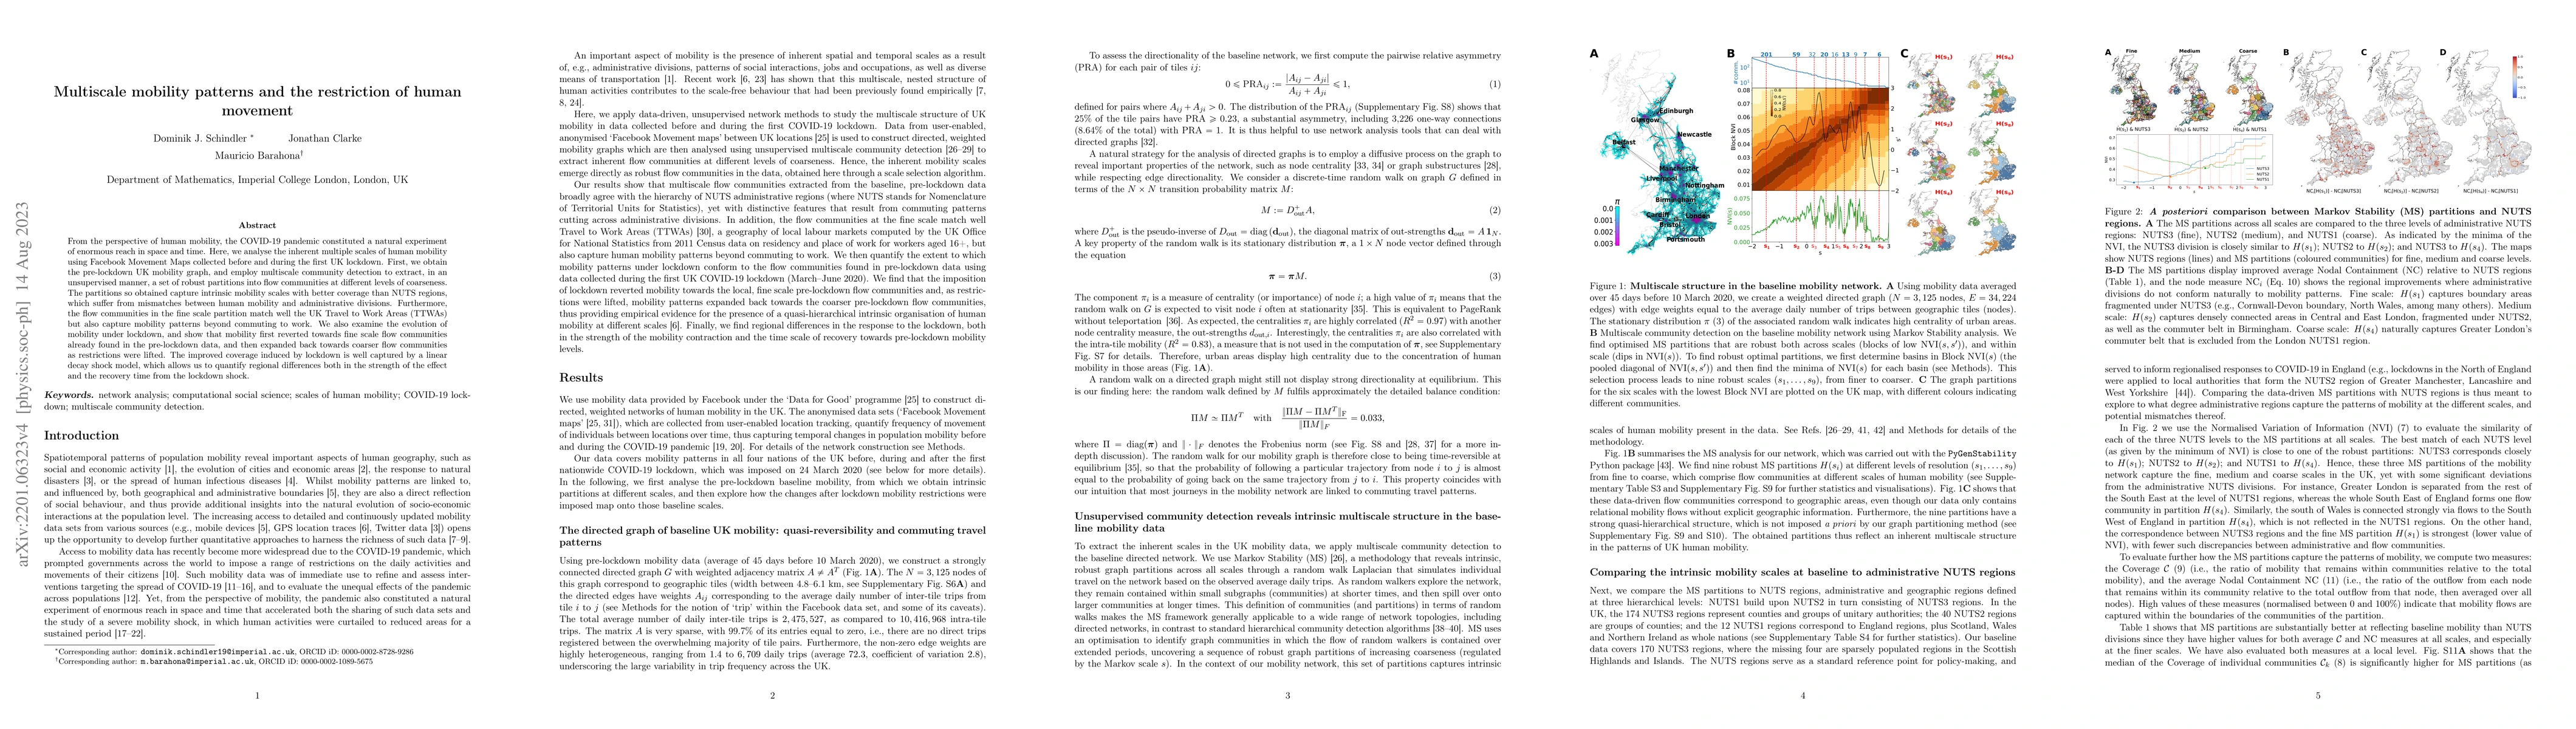
The MS partitions showed a significant correlation with NUTS regions — The TTWA division was found to be more similar to the fine-scale MS partition Hps1q More in Key Results →
Understanding human mobility patterns is crucial for public health and policy-making More in Significance →
The data used was limited to a specific time period and region — The network analysis approach may not capture all aspects of human mobility More in Limitations →
From the perspective of human mobility, the COVID-19 pandemic constituted a natural experiment of enormous reach in space and time. Here, we analyse the inherent multiple scales of human mobility using Facebook Movement Maps collected before and during the first UK lockdown. First, we obtain the pre-lockdown UK mobility graph, and employ multiscale community detection to extract, in an unsupervised manner, a set of robust partitions into flow communities at different levels of coarseness. The partitions so obtained capture intrinsic mobility scales with better coverage than NUTS regions, which suffer from mismatches between human mobility and administrative divisions. Furthermore, the flow communities in the fine scale partition match well the UK Travel to Work Areas (TTWAs) but also capture mobility patterns beyond commuting to work. We also examine the evolution of mobility under lockdown, and show that mobility first reverted towards fine scale flow communities already found in the pre-lockdown data, and then expanded back towards coarser flow communities as restrictions were lifted. The improved coverage induced by lockdown is well captured by a linear decay shock model, which allows us to quantify regional differences both in the strength of the effect and the recovery time from the lockdown shock.
Seven facets of this paper, analysed and brought into focus by AI.
Understanding human mobility patterns is crucial for public health and policy-making
A network analysis approach was used to identify patterns in human mobility data
Understanding human mobility patterns is crucial for public health and policy-making
A new method for identifying patterns in human mobility data using network analysis was developed
The use of MS partitions to describe human mobility patterns is a novel approach compared to existing methods
Current paper (gray), citations (green), references (blue)
Display is limited for performance on very large graphs.
Discussion 0