Normalized AOPC: Fixing Misleading Faithfulness Metrics for Feature Attribution Explainability
Publication
Metrics
AI Quick Summary
This paper proposes a normalized version of the area over the perturbation curve (NAOPC) to improve the reliability and interpretability of feature attribution methods in deep neural networks. It critiques the traditional AOPC for its sensitivity to model variations and lack of interpretability, suggesting NAOPC offers a more consistent and meaningful framework for evaluating faithfulness across different models.
Paper Preview
Abstract
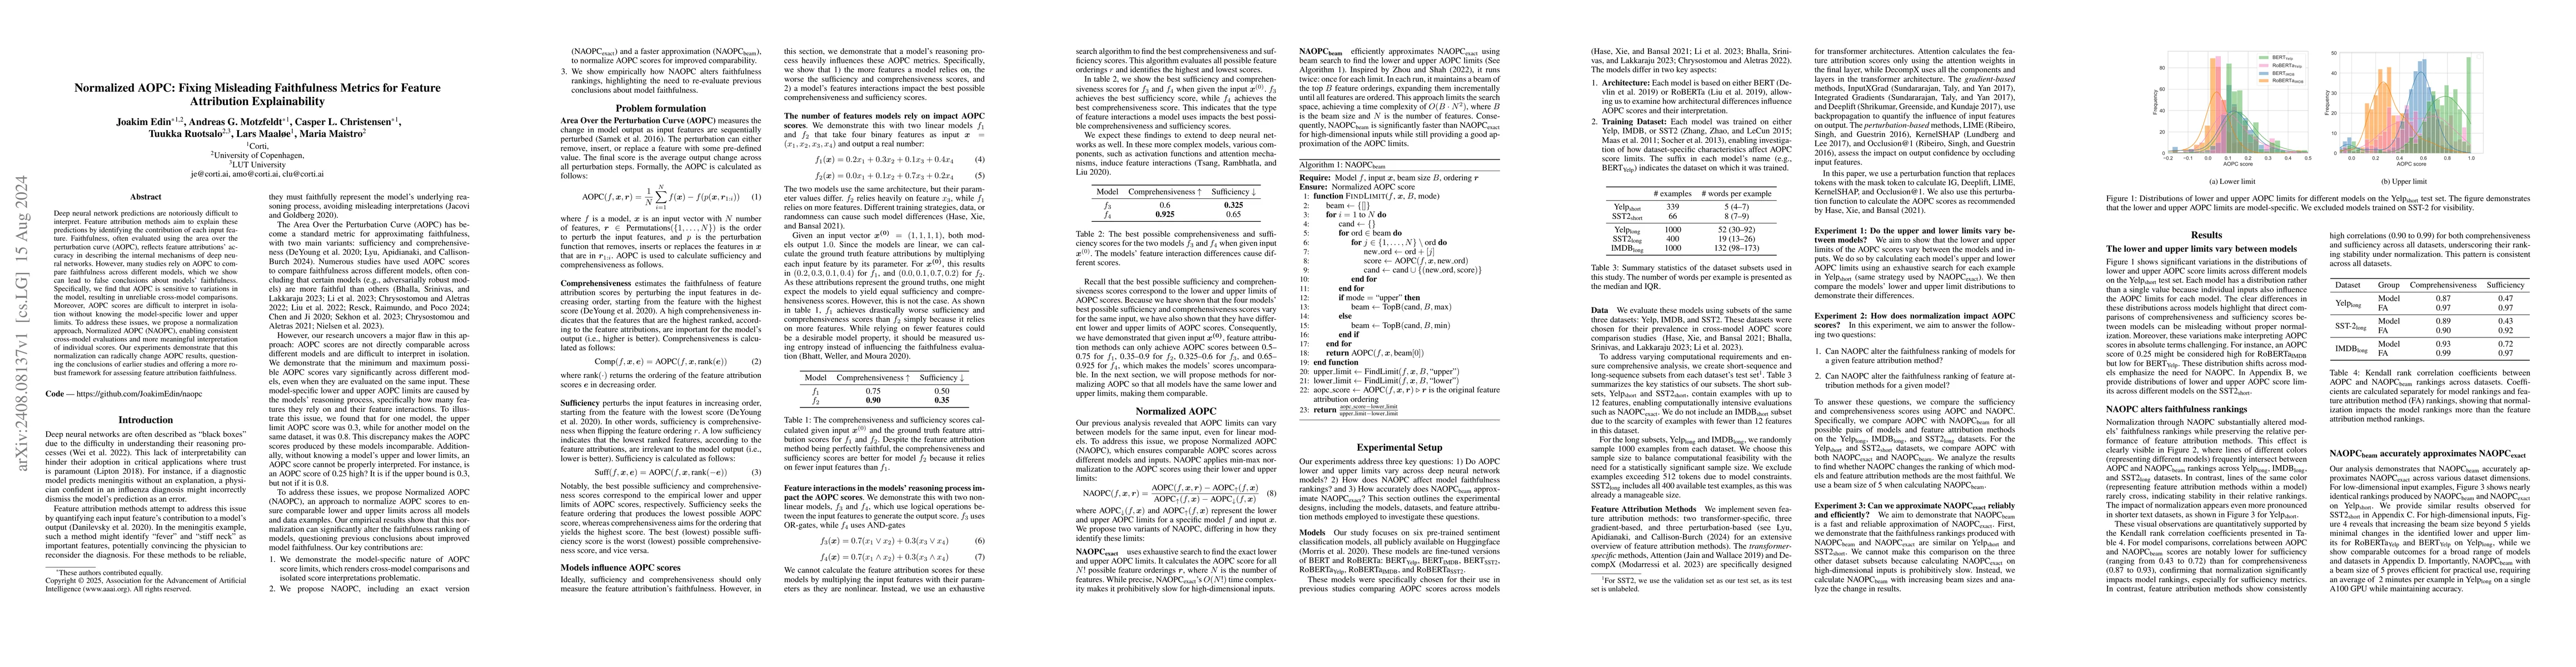
Deep neural network predictions are notoriously difficult to interpret. Feature attribution methods aim to explain these predictions by identifying the contribution of each input feature. Faithfulness, often evaluated using the area over the perturbation curve (AOPC), reflects feature attributions' accuracy in describing the internal mechanisms of deep neural networks. However, many studies rely on AOPC to compare faithfulness across different models, which we show can lead to false conclusions about models' faithfulness. Specifically, we find that AOPC is sensitive to variations in the model, resulting in unreliable cross-model comparisons. Moreover, AOPC scores are difficult to interpret in isolation without knowing the model-specific lower and upper limits. To address these issues, we propose a normalization approach, Normalized AOPC (NAOPC), enabling consistent cross-model evaluations and more meaningful interpretation of individual scores. Our experiments demonstrate that this normalization can radically change AOPC results, questioning the conclusions of earlier studies and offering a more robust framework for assessing feature attribution faithfulness.
AI Key Findings
Get AI-generated insights about this paper's methodology, results, significance, and more — seven facets brought into focus.
Impact
Authors
PDF Preview
Key Terms
Citation Network
Current paper (gray), citations (green), references (blue)
Display is limited for performance on very large graphs.
Discussion 0