Publication
Metrics
AI Quick Summary
This research uses extended kernel ridge regression (EKRR) to enhance nuclear charge radius predictions across five nuclear models, significantly reducing their root-mean-square deviations to 0.009-0.013 fm. The relativistic continuum Hartree-Bogoliubov (RCHB) model performed best with a deviation of 0.0092 fm, and the method also improved extrapolation for neutron-rich nuclei.
Paper Preview
Abstract
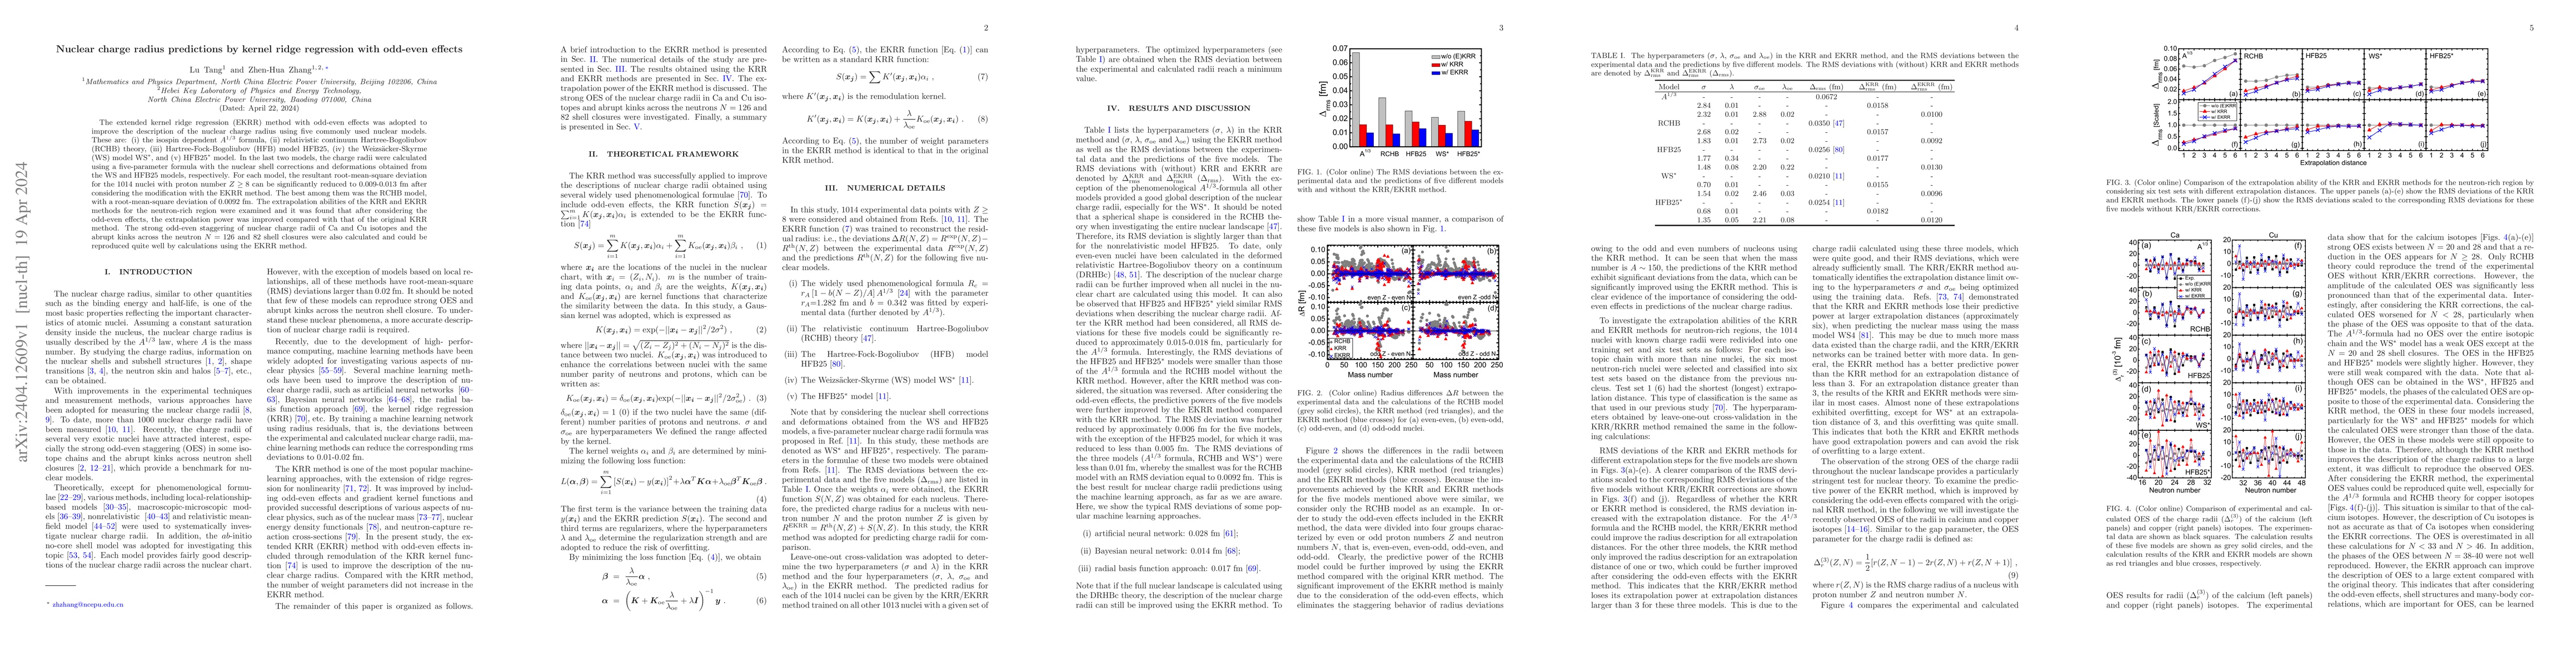
The extended kernel ridge regression (EKRR) method with odd-even effects was adopted to improve the description of the nuclear charge radius using five commonly used nuclear models. These are: (i) the isospin dependent $A^{1/3}$ formula, (ii) relativistic continuum Hartree-Bogoliubov (RCHB) theory, (iii) Hartree-Fock-Bogoliubov (HFB) model HFB25, (iv) the Weizs\"acker-Skyrme (WS) model WS$^\ast$, and (v) HFB25$^\ast$ model. In the last two models, the charge radii were calculated using a five-parameter formula with the nuclear shell corrections and deformations obtained from the WS and HFB25 models, respectively. For each model, the resultant root-mean-square deviation for the 1014 nuclei with proton number $Z \geq 8$ can be significantly reduced to 0.009-0.013~fm after considering the modification with the EKRR method. The best among them was the RCHB model, with a root-mean-square deviation of 0.0092~fm. The extrapolation abilities of the KRR and EKRR methods for the neutron-rich region were examined and it was found that after considering the odd-even effects, the extrapolation power was improved compared with that of the original KRR method. The strong odd-even staggering of nuclear charge radii of Ca and Cu isotopes and the abrupt kinks across the neutron $N=126$ and 82 shell closures were also calculated and could be reproduced quite well by calculations using the EKRR method.
AI Key Findings
Get AI-generated insights about this paper's methodology, results, significance, and more — seven facets brought into focus.
Impact
Paper Details
Authors
PDF Preview
Key Terms
Citation Network
Current paper (gray), citations (green), references (blue)
Display is limited for performance on very large graphs.
Discussion 0