Publication

Published: Oct 23, 2025
Categories: cs.HC, cs.DS, cs.GR

Metrics

Source: ArXiv

Quick Actions

View PDF

Quick Answers

What methodology did the authors use?

The research introduces a lexicographic minimax optimization framework for reordering features in radar charts. It employs exhaustive search for small-to-moderate feature sets, prioritizing mean adjacent jump for overall smoothness and using maximum jump as a tie-breaker to mitigate extreme spikes. More in Methodology →

What are the key results?

The method produces visually balanced and perceptually coherent radar charts by optimizing feature ordering — Exhaustive minimax approach ensures global optimality for up to 10 features, which aligns with human interpretability limits More in Key Results →

Why is this work significant?

This research addresses critical distortion issues in radar chart visualization by providing an interpretable and deterministic optimization strategy. It enhances multi-profile comparison accuracy and supports better data interpretation in exploratory analysis and model explanation tasks. More in Significance →

What are the main limitations?

Exhaustive search becomes computationally prohibitive for large feature sets (p > 10) — Reliance on mean and maximum jump metrics may not capture all aspects of visual smoothness More in Limitations →

Paper Preview

Abstract

Radar charts are widely used to visualize multivariate data and compare multiple profiles across features. However, the visual clarity of radar charts can be severely compromised when feature values alternate drastically in magnitude around the circle, causing areas to collapse, which misrepresents relative differences. In the present work we introduce a permutation optimization strategy that reorders features to minimize polygon ``spikiness'' across multiple profiles simultaneously. The method is combinatorial (exhaustive search) for moderate numbers of features and uses a lexicographic minimax criterion that first considers overall smoothness (mean jump) and then the largest single jump as a tie-breaker. This preserves more global information and produces visually balanced arrangements. We discuss complexity, practical bounds, and relations to existing approaches that either change the visualization (e.g., OrigamiPlot) or learn orderings (e.g., Versatile Ordering 
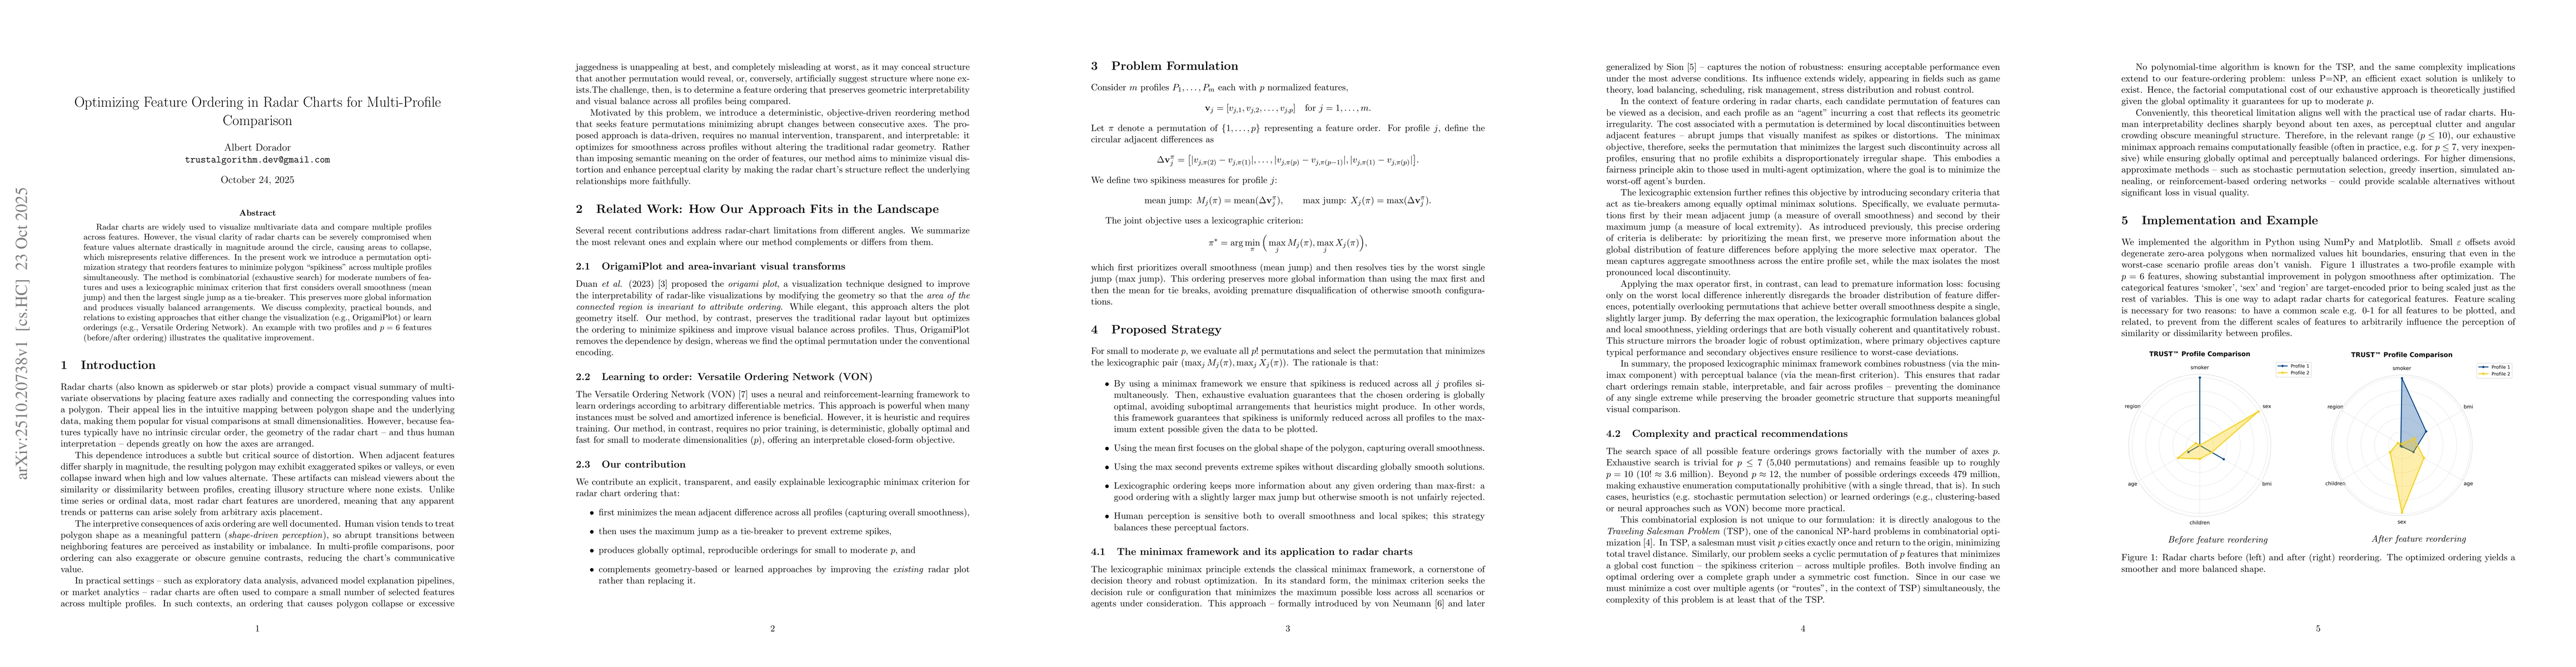
Network). An example with two profiles and $p=6$ features (before/after ordering) illustrates the qualitative improvement. Keywords: data visualization, radar charts, combinatorial optimization, minimax optimization, feature ordering

AI Key Findings

Generated Oct 25, 2025

Methodology — What approach did the authors take?

The research introduces a lexicographic minimax optimization framework for reordering features in radar charts. It employs exhaustive search for small-to-moderate feature sets, prioritizing mean adjacent jump for overall smoothness and using maximum jump as a tie-breaker to mitigate extreme spikes.

Key Results — What are the main findings?

  • The method produces visually balanced and perceptually coherent radar charts by optimizing feature ordering
  • Exhaustive minimax approach ensures global optimality for up to 10 features, which aligns with human interpretability limits
  • Implementation demonstrates significant improvement in polygon smoothness compared to non-optimized ordering

Significance — Why does this research matter?

This research addresses critical distortion issues in radar chart visualization by providing an interpretable and deterministic optimization strategy. It enhances multi-profile comparison accuracy and supports better data interpretation in exploratory analysis and model explanation tasks.

Technical Contribution — What is the technical contribution?

A principled deterministic optimization framework combining lexicographic minimax principles with feature ordering for radar charts, ensuring both global optimality and perceptual balance

Novelty — What is new about this work?

The work introduces a novel approach that retains traditional radar chart structure while significantly improving interpretability through optimized feature ordering, differing from geometric transformation methods like Origami Plot

Limitations — What are the limitations of this study?

  • Exhaustive search becomes computationally prohibitive for large feature sets (p > 10)
  • Reliance on mean and maximum jump metrics may not capture all aspects of visual smoothness

Future Work — What did the authors propose for future work?

  • Explore heuristic methods like stochastic permutation selection for scalability
  • Investigate alternative metrics such as variance or percentile-based jump measures
  • Validate perceptual benefits through user studies for optimized ordering

Paper Details

Paper ID: 2510.20738
Categories:
cs.HC cs.DS cs.GR math.OC stat.OT

How to Cite This Paper

BibTeX
@article{dorador2025optimizing,
  title         = {Optimizing Feature Ordering in Radar Charts for Multi-Profile Comparison},
  author        = {Dorador, Albert},
  year          = {2025},
  eprint        = {2510.20738},
  archivePrefix = {arXiv},
  primaryClass  = {cs.HC},
}
APA 7
Dorador, A. (2025). Optimizing Feature Ordering in Radar Charts for Multi-Profile Comparison. arXiv. https://arxiv.org/abs/2510.20738
MLA 9
Dorador, Albert. "Optimizing Feature Ordering in Radar Charts for Multi-Profile Comparison." arXiv, 2025, arxiv.org/abs/2510.20738.

Similar Papers

Found 4 papers

OptiSeq: Optimizing Example Ordering for In-Context Learning

Rahul Atul Bhope, Praveen Venkateswaran, K. R. Jayaram et al.

2025-01-25

Control Charts for Multi-agent Systems

Hayden Helm, Carey Priebe, Brandon Duderstadt

2026-05-11

Comments (0)

This website uses cookies to ensure you get the best experience. Learn more