01
MethodologyHow they did it
The research used a combination of data visualization methods to analyze standardized exam performance in Illinois schools.
The research used a combination of data visualization methods to analyze standardized exam performance in Illinois schools. More in Methodology →
Illinois schools outside of Chicago consistently depend on poverty concentration for exam scores. — Chicago schools have higher average exam scores than the rest of the state at each grade level and poverty level. More in Key Results →
This research highlights the importance of addressing socioeconomic disparities in education to improve student outcomes. More in Significance →
The analysis was limited by the availability and quality of data on charter schools in Illinois. — The study did not control for other factors that may influence exam performance, such as student demographics or school resources. More in Limitations →
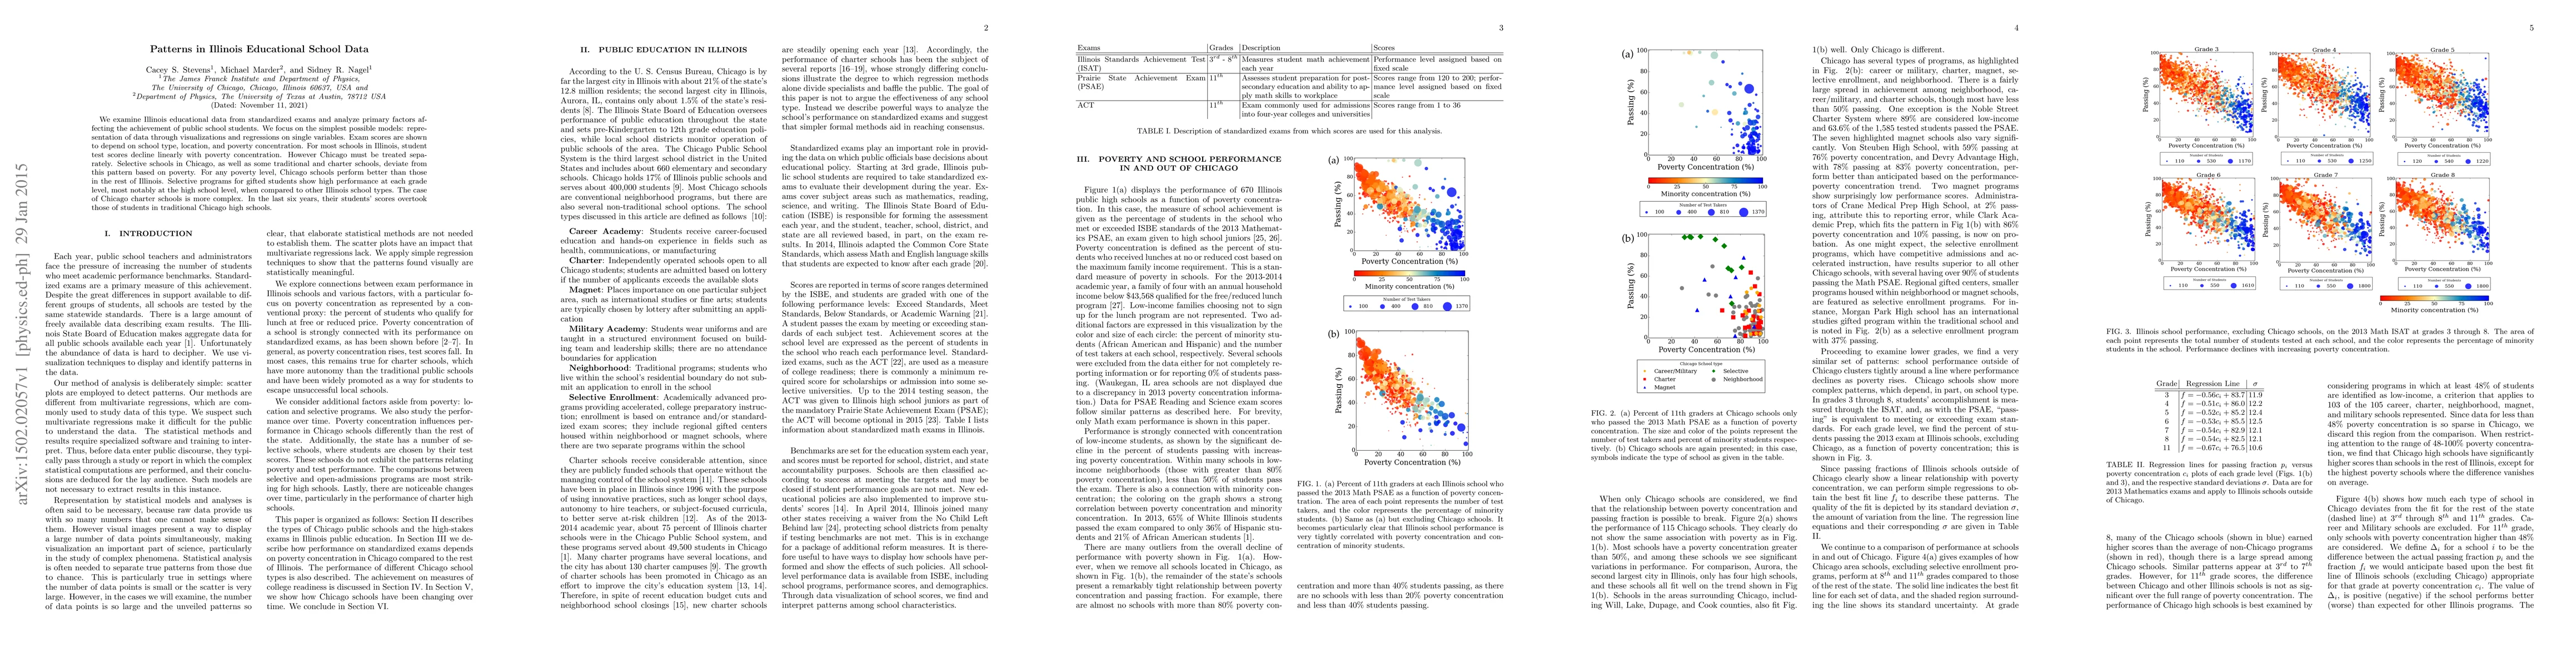
We examine Illinois educational data from standardized exams and analyze primary factors affecting the achievement of public school students. We focus on the simplest possible models: representation of data through visualizations and regressions on single variables. Exam scores are shown to depend on school type, location, and poverty concentration. For most schools in Illinois, student test scores decline linearly with poverty concentration. However Chicago must be treated separately. Selective schools in Chicago, as well as some traditional and charter schools, deviate from this pattern based on poverty. For any poverty level, Chicago schools perform better than those in the rest of Illinois. Selective programs for gifted students show high performance at each grade level, most notably at the high school level, when compared to other Illinois school types. The case of Chicago charter schools is more complex. In the last six years, their students' scores overtook those of students in traditional Chicago high schools.
Seven facets of this paper, analysed and brought into focus by AI.
This research highlights the importance of addressing socioeconomic disparities in education to improve student outcomes.
The research used a combination of data visualization methods to analyze standardized exam performance in Illinois schools.
This research highlights the importance of addressing socioeconomic disparities in education to improve student outcomes.
The research developed a novel approach to visualizing and analyzing large datasets to identify patterns in standardized exam performance.
This study is distinct from existing research on education policy by using data visualization methods to reveal the complex relationships between poverty, exam scores, and school type.
Current paper (gray), citations (green), references (blue)
Display is limited for performance on very large graphs.
Discussion 0