Publication
Metrics
Paper Preview
Abstract
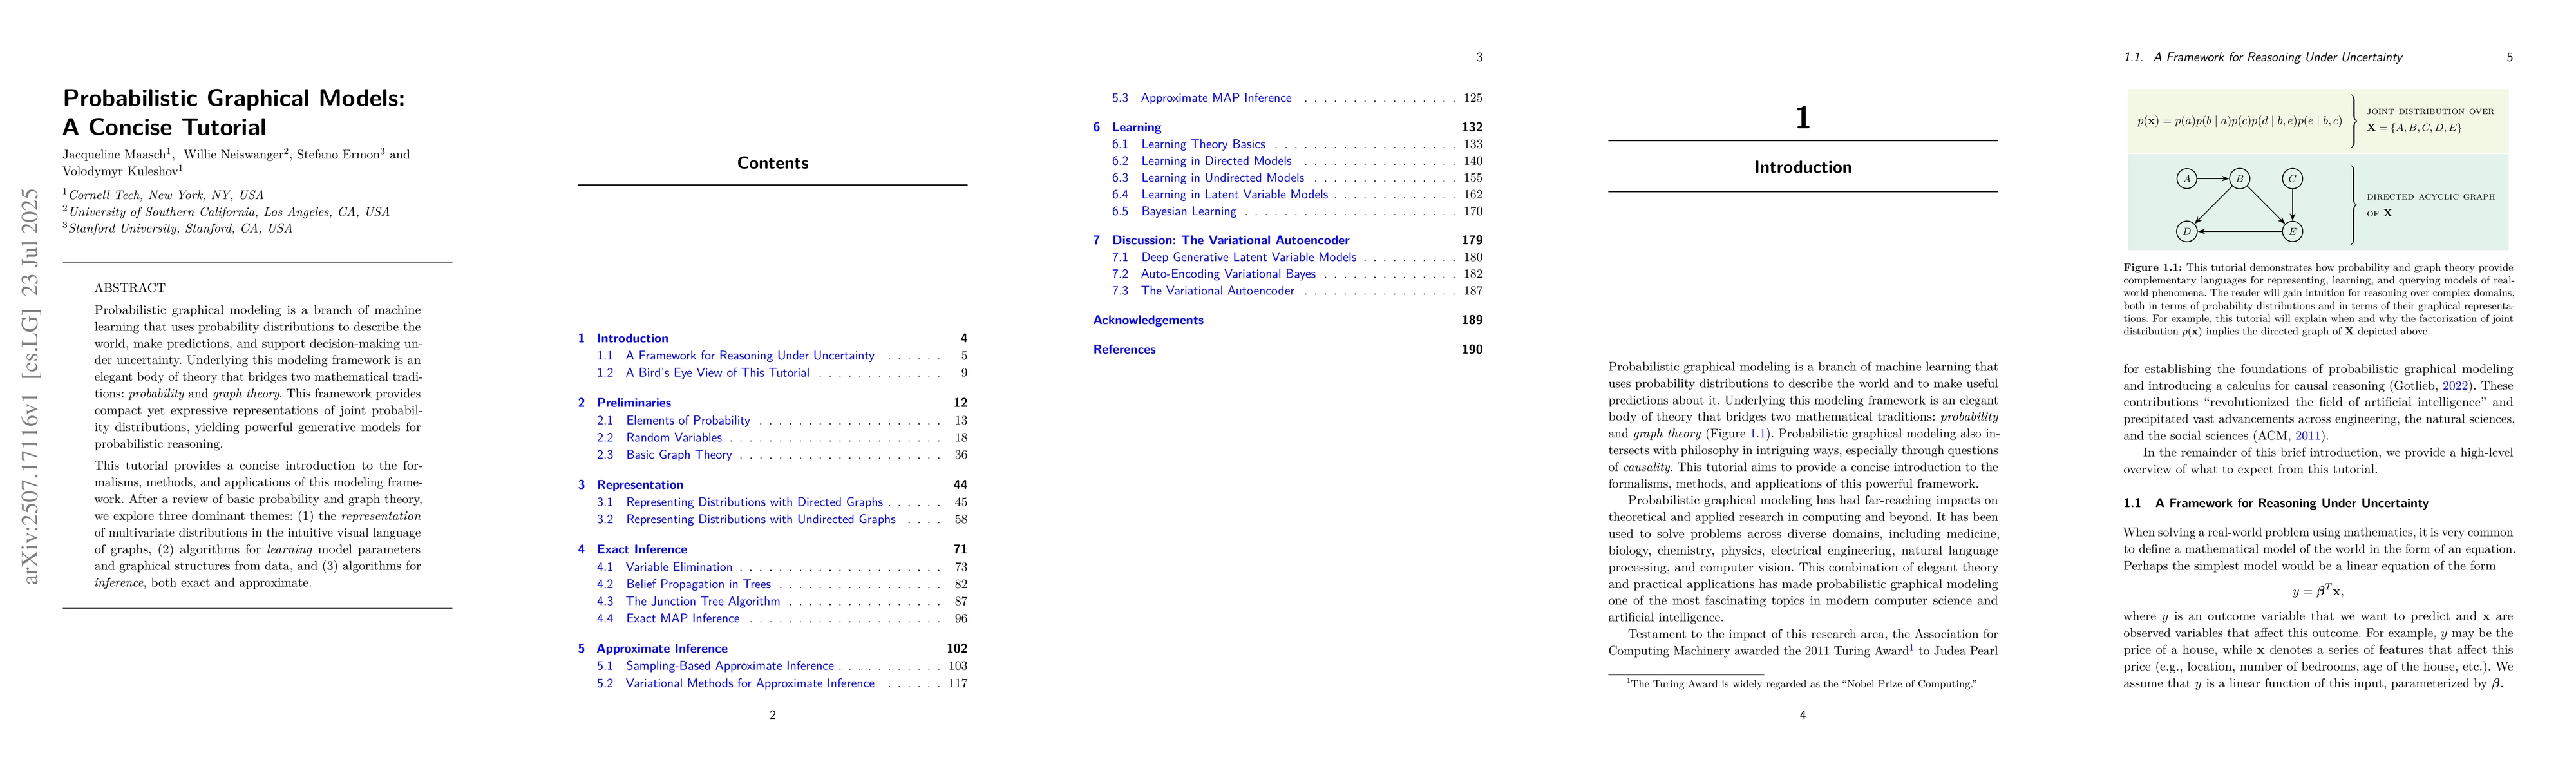
Probabilistic graphical modeling is a branch of machine learning that uses probability distributions to describe the world, make predictions, and support decision-making under uncertainty. Underlying this modeling framework is an elegant body of theory that bridges two mathematical traditions: probability and graph theory. This framework provides compact yet expressive representations of joint probability distributions, yielding powerful generative models for probabilistic reasoning. This tutorial provides a concise introduction to the formalisms, methods, and applications of this modeling framework. After a review of basic probability and graph theory, we explore three dominant themes: (1) the representation of multivariate distributions in the intuitive visual language of graphs, (2) algorithms for learning model parameters and graphical structures from data, and (3) algorithms for inference, both exact and approximate.
AI Key Findings
Get AI-generated insights about this paper's methodology, results, significance, and more — seven facets brought into focus.
Paper Details
Authors
PDF Preview
Related Papers
No references found for this paper.
Discussion 0