Quantifying Hidden Architectural Patterns in Metaplastic Tumors by Calculating the Quadrant-Slope Index (QSI)
Publication
Metrics
Paper Preview
Abstract
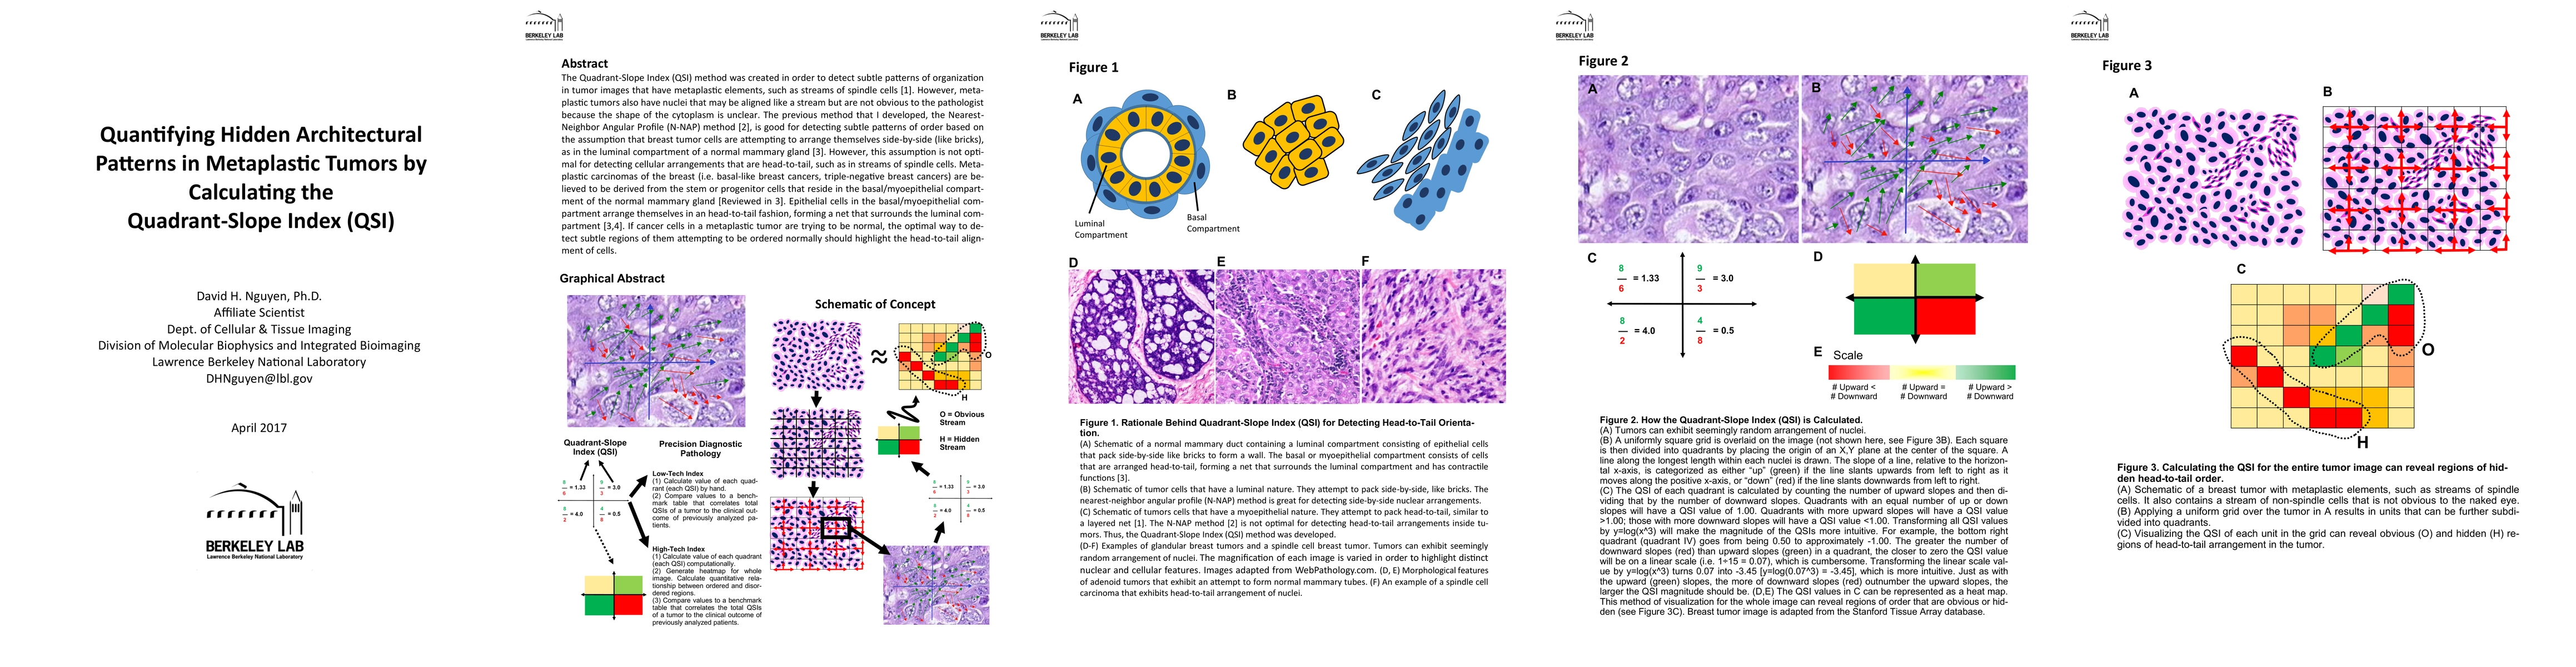
The Quadrant-Slope Index (QSI) method was created in order to detect subtle patterns of organization in tumor images that have metaplastic elements, such as streams of spindle cells [1]. However, metaplastic tumors also have nuclei that may be aligned like a stream but are not obvious to the pathologist because the shape of the cytoplasm is unclear. The previous method that I developed, the Nearest-Neighbor Angular Profile (N-NAP) method [2], is good for detecting subtle patterns of order based on the assumption that breast tumor cells are attempting to arrange themselves side-by-side (like bricks), as in the luminal compartment of a normal mammary gland [3]. However, this assumption is not optimal for detecting cellular arrangements that are head-to-tail, such as in streams of spindle cells. Metaplastic carcinomas of the breast (i.e. basal-like breast cancers, triple-negative breast cancers) are believed to be derived from the stem or progenitor cells that reside in the basal/myoepithelial compartment of the normal mammary gland [Reviewed in 3]. Epithelial cells in the basal/myoepithelial compartment arrange themselves in an head-to-tail fashion, forming a net that surrounds the luminal compartment [3,4]. If cancer cells in a metaplastic tumor are trying to be normal, the optimal way to detect subtle regions of them attempting to be ordered normally should highlight the head-to-tail alignment of cells.
AI Key Findings
Get AI-generated insights about this paper's methodology, results, significance, and more — seven facets brought into focus.
Impact
Paper Details
PDF Preview
Key Terms
Citation Network
Current paper (gray), citations (green), references (blue)
Display is limited for performance on very large graphs.
Discussion 0