Publication
Metrics
Paper Preview
Abstract
Student appreciation of a function is enhanced by understanding the graphical representation of that function. From the real graph of a polynomial, students can identify real-valued solutions to polynomial equations that correspond to the symbolic form. However, the real graph does not show the non-real solutions to polynomial equations. Instead of enhancing students idea of a function, the traditional graph implies a clear disconnect from the symbolic form. In order to fully appreciate the Fundamental Theorem of Algebra, and the non-real solutions of a polynomial equation, traditional graphs are inadequate. Since the early 20th century, mathematicians have tried to find a way to augment the traditional Cartesian graph of a polynomial to show its complex counterpart. Advancements in computer graphics allow us to easily illustrate a more complete graph of polynomial functions that is still accessible to students of many different levels. The authors will demonstrate a method using modern 3D graphical tools such as GeoGebra to create dynamic visualizations of these more complete polynomial functions.
AI Key Findings
Get AI-generated insights about this paper's methodology, results, significance, and more — seven facets brought into focus.
Impact
Paper Details
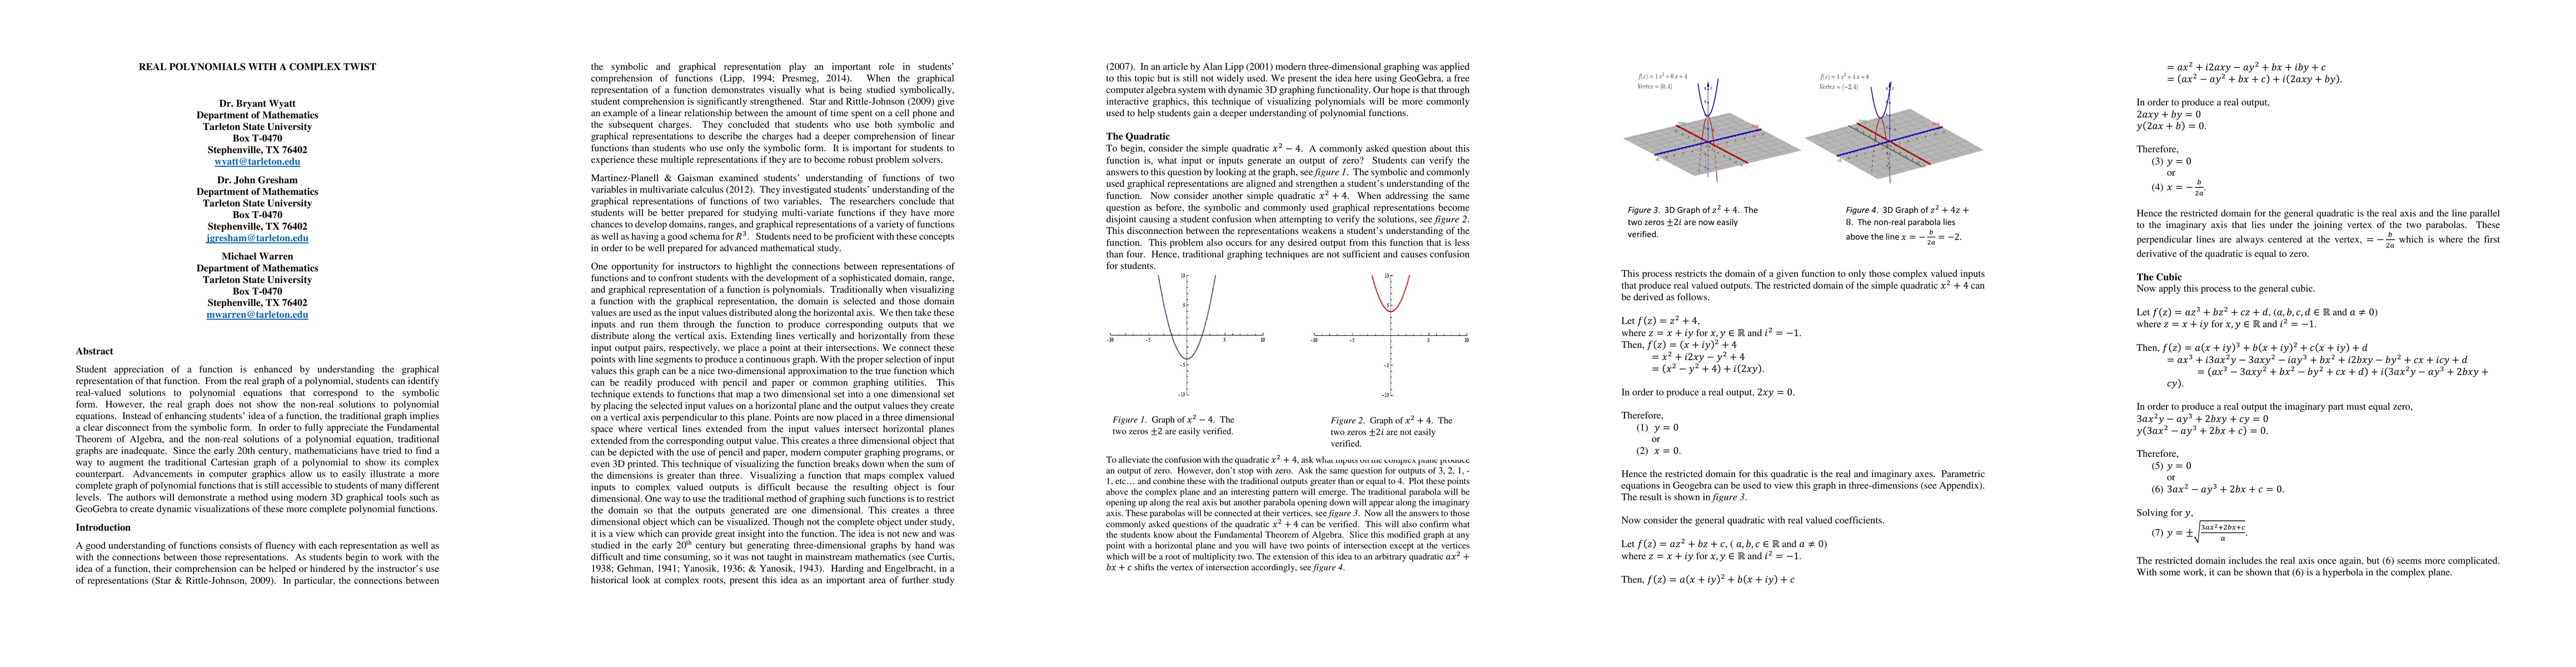
PDF Preview
Key Terms
Citation Network
Current paper (gray), citations (green), references (blue)
Display is limited for performance on very large graphs.
Discussion 0