Publication
Metrics
AI Quick Summary
This paper proposes a Degradation Relationship Index (DRI) to quantify the relationship between different image degradations and introduces a method (DPD) to estimate if combining these degradations can improve restoration performance. Experimental results show that appropriate degradation proportions enhance restoration tasks like dehazing and denoising.
Paper Preview
Abstract
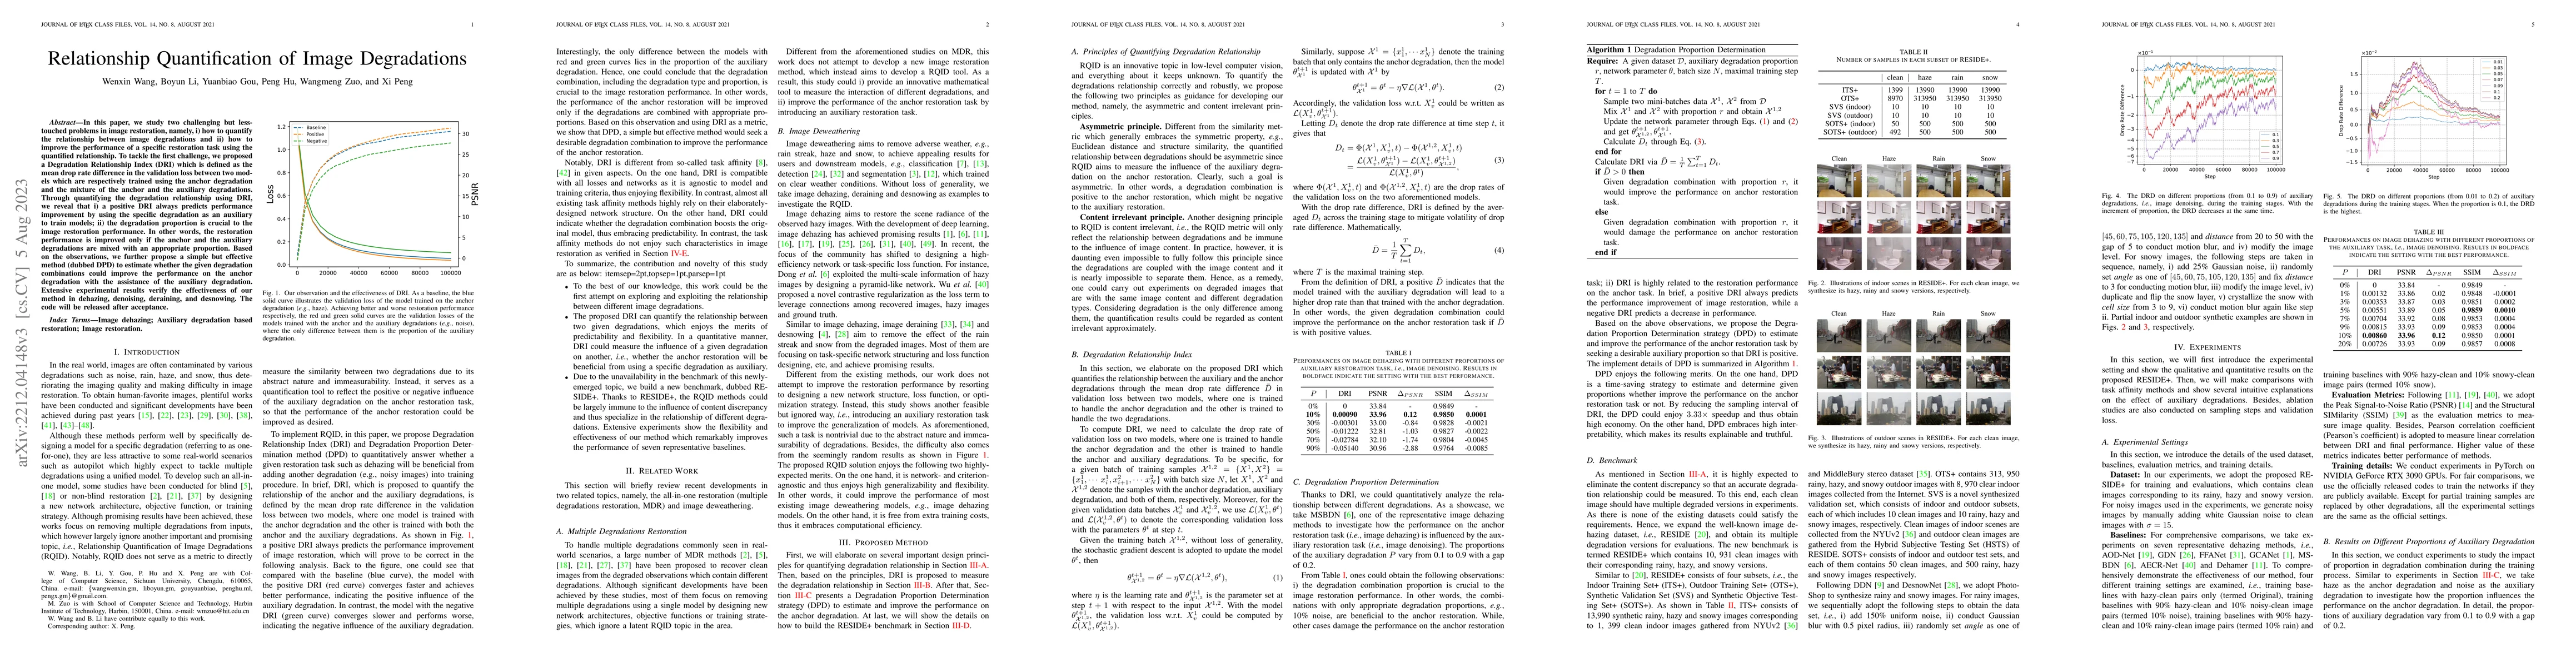
In this paper, we study two challenging but less-touched problems in image restoration, namely, i) how to quantify the relationship between image degradations and ii) how to improve the performance of a specific restoration task using the quantified relationship. To tackle the first challenge, we proposed a Degradation Relationship Index (DRI) which is defined as the mean drop rate difference in the validation loss between two models which are respectively trained using the anchor degradation and the mixture of the anchor and the auxiliary degradations. Through quantifying the degradation relationship using DRI, we reveal that i) a positive DRI always predicts performance improvement by using the specific degradation as an auxiliary to train models; ii) the degradation proportion is crucial to the image restoration performance. In other words, the restoration performance is improved only if the anchor and the auxiliary degradations are mixed with an appropriate proportion. Based on the observations, we further propose a simple but effective method (dubbed DPD) to estimate whether the given degradation combinations could improve the performance on the anchor degradation with the assistance of the auxiliary degradation. Extensive experimental results verify the effectiveness of our method in dehazing, denoising, deraining, and desnowing. The code will be released after acceptance.
AI Key Findings
Get AI-generated insights about this paper's methodology, results, significance, and more — seven facets brought into focus.
Impact
Paper Details
Authors
PDF Preview
Key Terms
Citation Network
Current paper (gray), citations (green), references (blue)
Display is limited for performance on very large graphs.
Discussion 0