Revealing hidden correlations from complex spatial distributions: Adjacent Correlation Analysis
Publication
Metrics
AI Quick Summary
Researchers developed a new method called Adjacent Correlation Analysis to uncover hidden correlations in complex spatial distributions by representing local patterns as correlation vectors in phase space.
Paper Preview
Abstract
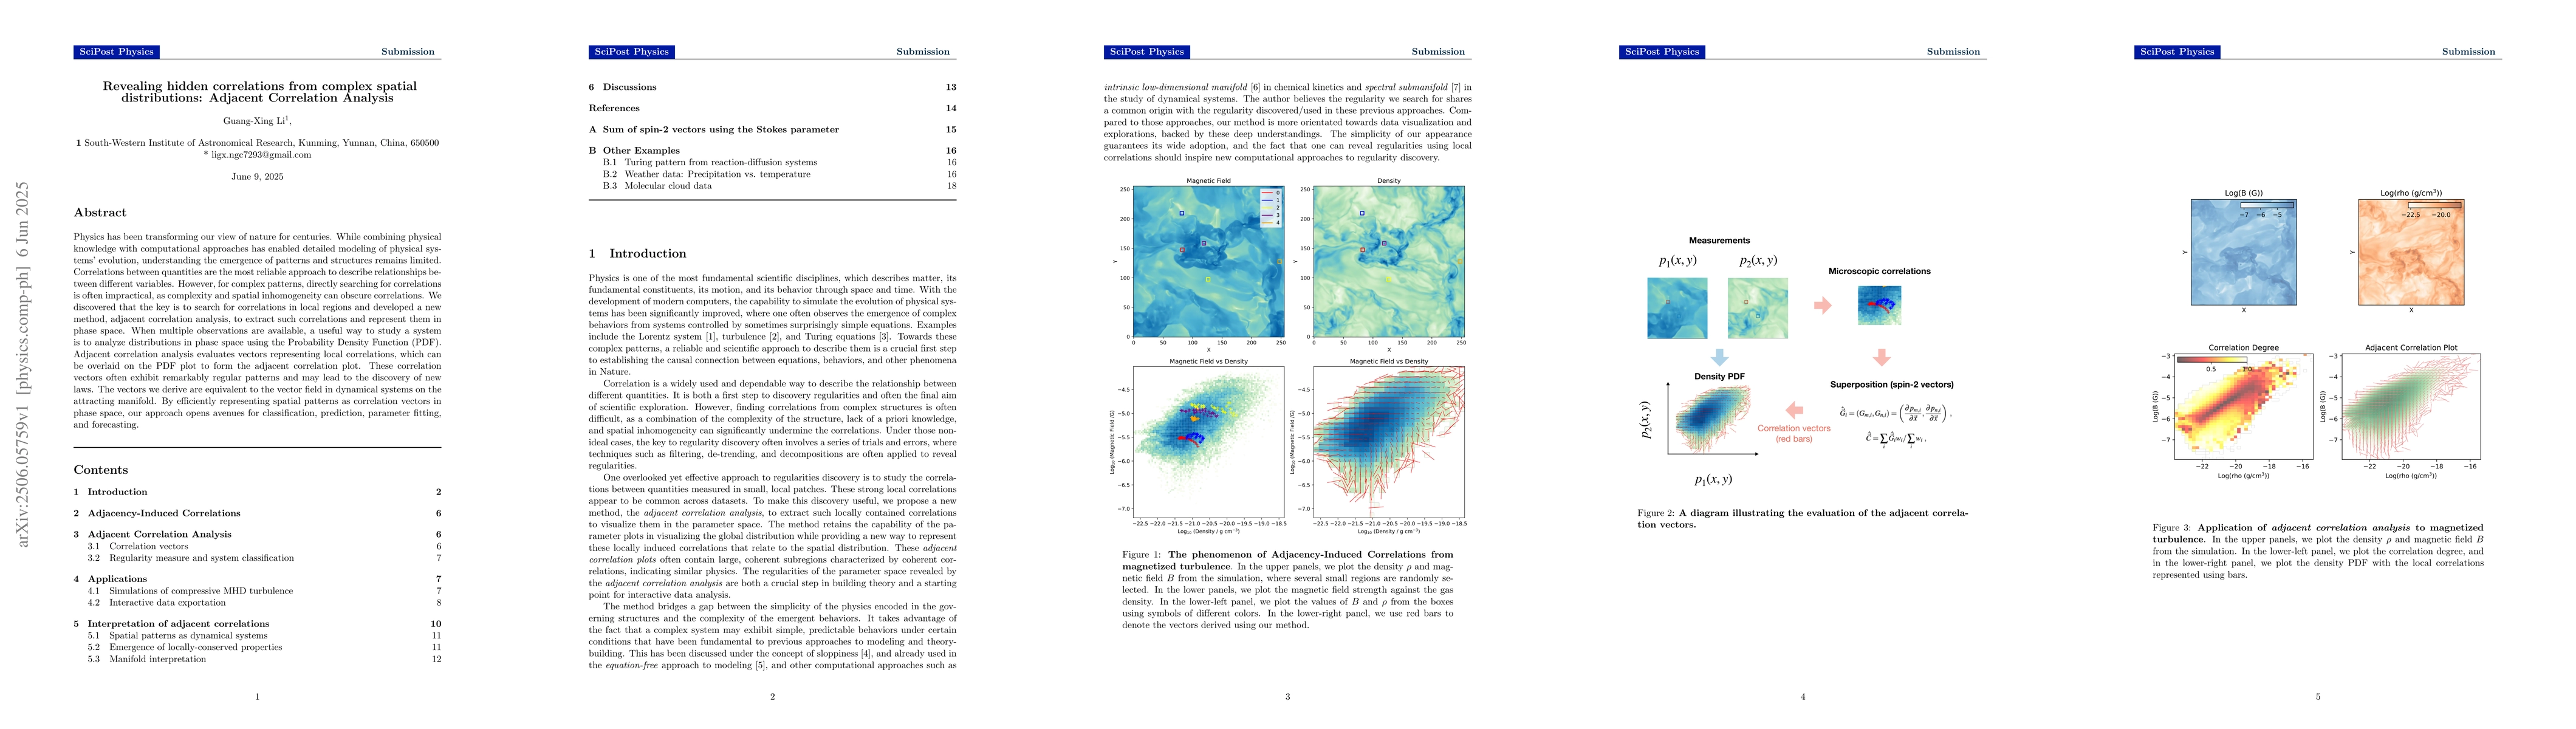
Physics has been transforming our view of nature for centuries. While combining physical knowledge with computational approaches has enabled detailed modeling of physical systems' evolution, understanding the emergence of patterns and structures remains limited. Correlations between quantities are the most reliable approach to describe relationships between different variables. However, for complex patterns, directly searching for correlations is often impractical, as complexity and spatial inhomogeneity can obscure correlations. We discovered that the key is to search for correlations in local regions and developed a new method, adjacent correlation analysis, to extract such correlations and represent them in phase space. When multiple observations are available, a useful way to study a system is to analyze distributions in phase space using the Probability Density Function (PDF). Adjacent correlation analysis evaluates vectors representing local correlations, which can be overlaid on the PDF plot to form the adjacent correlation plot. These correlation vectors often exhibit remarkably regular patterns and may lead to the discovery of new laws. The vectors we derive are equivalent to the vector field in dynamical systems on the attracting manifold. By efficiently representing spatial patterns as correlation vectors in phase space, our approach opens avenues for classification, prediction, parameter fitting, and forecasting.
AI Key Findings
Get AI-generated insights about this paper's methodology, results, significance, and more — seven facets brought into focus.
Impact
Paper Details
Authors
PDF Preview
Citation Network
Current paper (gray), citations (green), references (blue)
Display is limited for performance on very large graphs.
Discussion 0