SD2: Slicing and Dicing Scholarly Data for Interactive Evaluation of Academic Performance
Publication
Metrics
AI Quick Summary
This paper introduces SD2, an interactive visualization framework for analyzing scholarly data, enabling flexible partitioning and composition of data for various analysis tasks. It demonstrates the effectiveness of SD2 through expert evaluation and usage scenarios to answer commonly raised questions about academic performance.
Paper Preview
Abstract
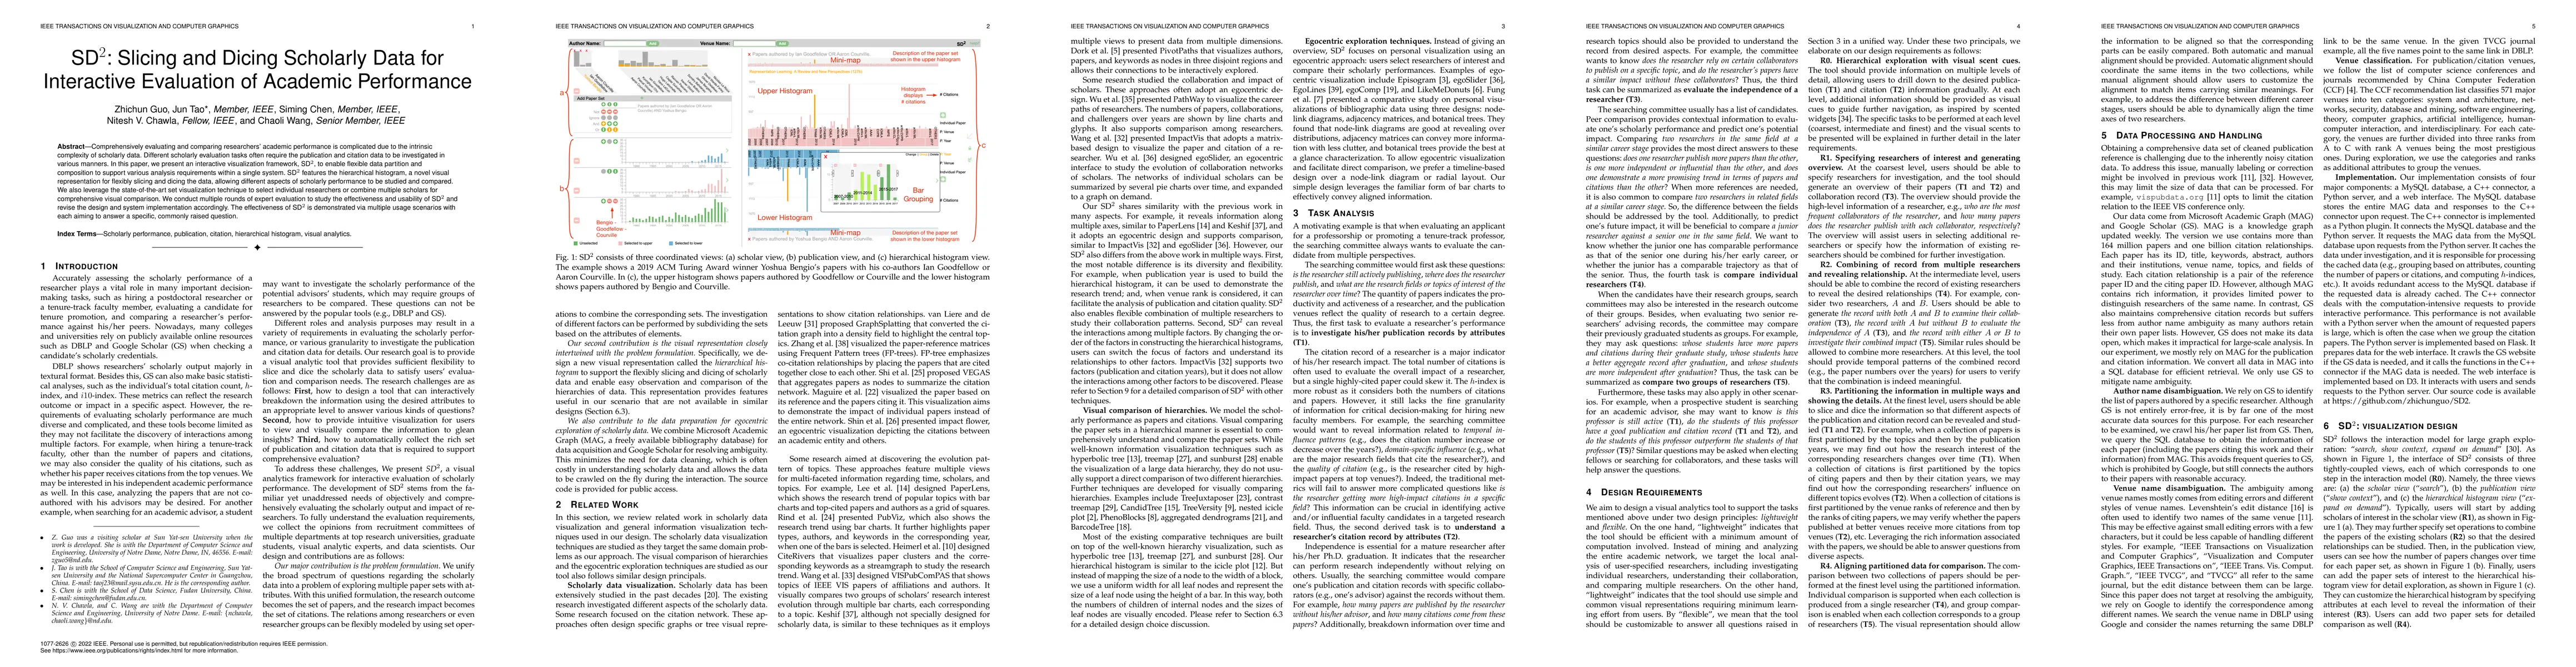
Comprehensively evaluating and comparing researchers' academic performance is complicated due to the intrinsic complexity of scholarly data. Different scholarly evaluation tasks often require the publication and citation data to be investigated in various manners. In this paper, we present an interactive visualization framework, SD2, to enable flexible data partition and composition to support various analysis requirements within a single system. SD2 features the hierarchical histogram, a novel visual representation for flexibly slicing and dicing the data, allowing different aspects of scholarly performance to be studied and compared. We also leverage the state-of-the-art set visualization technique to select individual researchers or combine multiple scholars for comprehensive visual comparison. We conduct multiple rounds of expert evaluation to study the effectiveness and usability of SD2 and revise the design and system implementation accordingly. The effectiveness of SD2 is demonstrated via multiple usage scenarios with each aiming to answer a specific, commonly raised question.
AI Key Findings
Get AI-generated insights about this paper's methodology, results, significance, and more — seven facets brought into focus.
Impact
Paper Details
Authors
PDF Preview
Key Terms
Citation Network
Current paper (gray), citations (green), references (blue)
Display is limited for performance on very large graphs.
Discussion 0