Quick Answers
What methodology did the authors use?
Developed a browser‑based dashboard that integrates semantic zooming with a modified skeleton‑based edge bundling algorithm, applied to a dataset of 51,371 e‑commerce orders aggregated to 202 warehouse‑to‑state flows, and evaluated through two real‑world scenarios. More in Methodology →
What are the key results?
254× reduction in visual complexity while preserving flow metadata — Bundled visualizations revealed cross‑country routing inefficiencies and inventory mismatches that were not apparent in tabular data More in Key Results →
Why is this work significant?
The work demonstrates that a single, zoom‑driven interface can simultaneously support strategic flow monitoring, regional demand mapping, and operational inventory analysis, thereby improving decision‑making speed and accuracy in supply‑chain operations. More in Significance →
What are the main limitations?
Evaluation limited to a single month and four warehouses, so generalizability to larger, multi‑provider networks is uncertain — Parameter settings (grid resolution, detour thresholds) were tuned for this dataset, requiring re‑tuning for other contexts More in Limitations →
Abstract
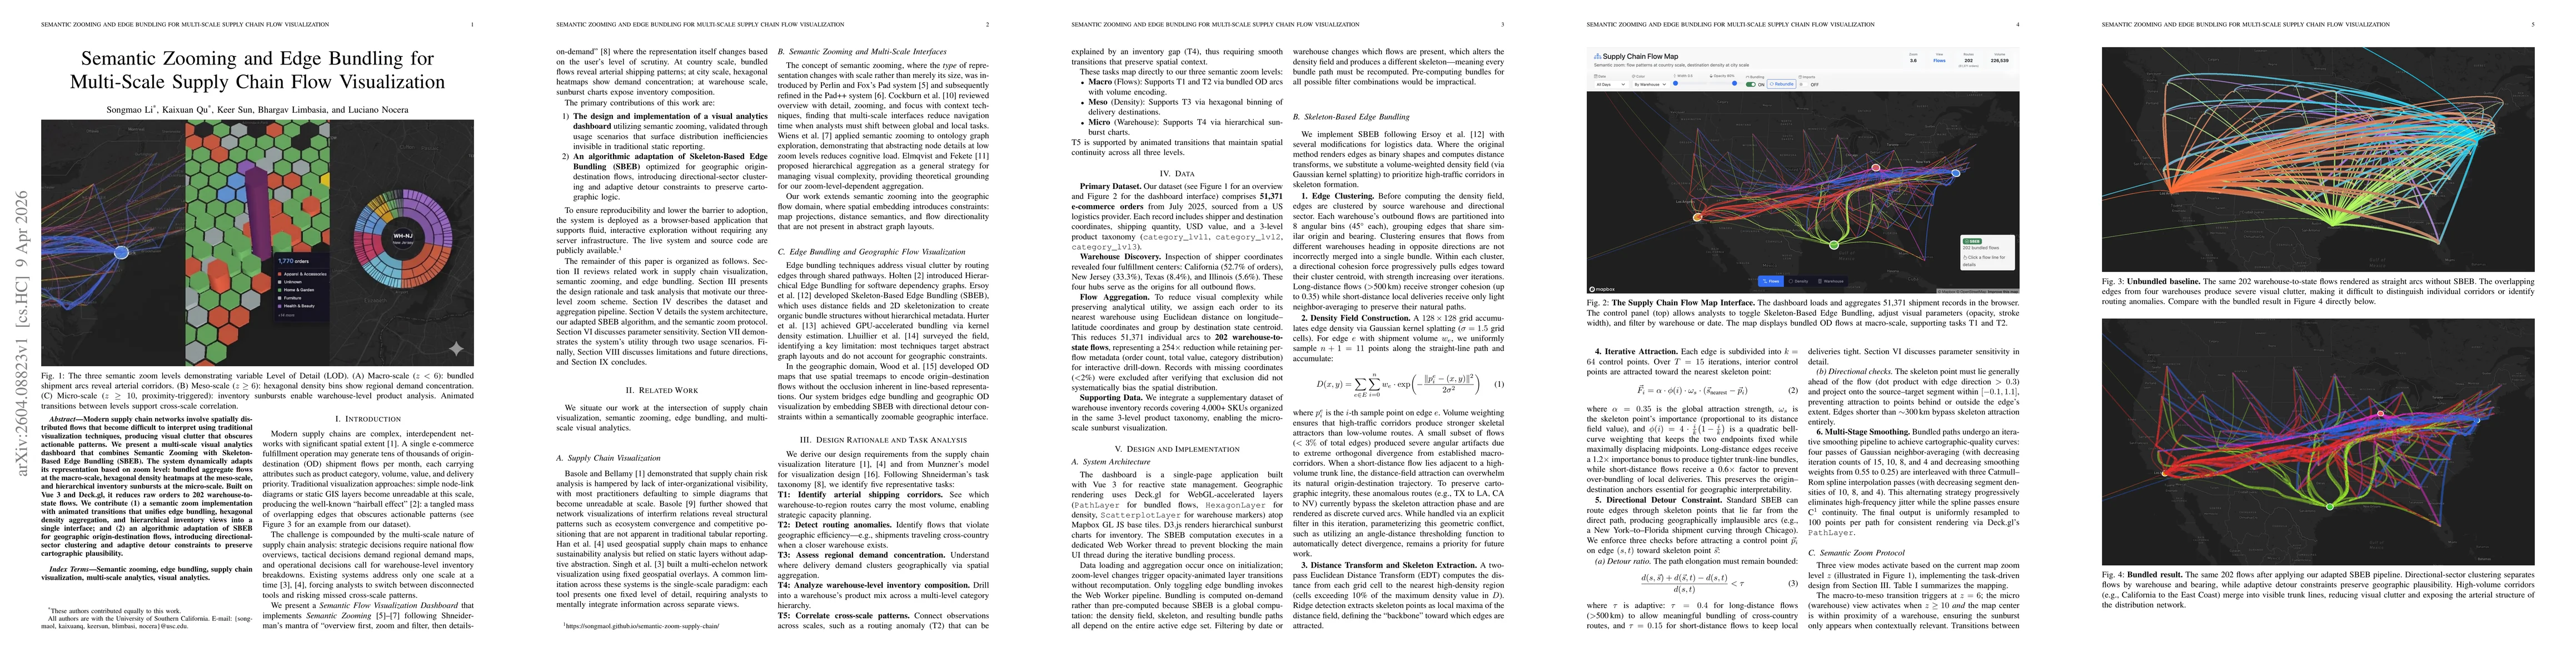
Modern supply chain networks involve spatially distributed flows that become difficult to interpret using traditional visualization techniques, producing visual clutter that obscures actionable patterns. We present a multi-scale visual analytics dashboard that combines Semantic Zooming with Skeleton-Based Edge Bundling (SBEB). The system dynamically adapts its representation based on zoom level: bundled aggregate flows at the macro-scale, hexagonal density heatmaps at the meso-scale, and hierarchical inventory sunbursts at the micro-scale. Built on Vue3 and Deck.gl, it reduces raw orders to 202 warehouse-to-state flows. We contribute (1)a semantic zoom implementation with animated transitions that unifies edge bundling, hexagonal density aggregation, and hierarchical inventory views into a single interface; and (2)an algorithmic adaptation of SBEB for geographic origin-destination flows, introducing directional-sector clustering and adaptive detour constraints to preserve cartographic plausibility.
AI Key Findings
Generated Apr 13, 2026
Methodology — What approach did the authors take?
Developed a browser‑based dashboard that integrates semantic zooming with a modified skeleton‑based edge bundling algorithm, applied to a dataset of 51,371 e‑commerce orders aggregated to 202 warehouse‑to‑state flows, and evaluated through two real‑world scenarios.
Key Results — What are the main findings?
- 254× reduction in visual complexity while preserving flow metadata
- Bundled visualizations revealed cross‑country routing inefficiencies and inventory mismatches that were not apparent in tabular data
- System achieved <50 ms transition latency and 2.5 s bundling time, enabling interactive exploration
Significance — Why does this research matter?
The work demonstrates that a single, zoom‑driven interface can simultaneously support strategic flow monitoring, regional demand mapping, and operational inventory analysis, thereby improving decision‑making speed and accuracy in supply‑chain operations.
Technical Contribution — What is the technical contribution?
An algorithmic adaptation of skeleton‑based edge bundling for geographic origin‑destination flows, featuring directional‑sector clustering, adaptive detour constraints, and a multi‑stage smoothing pipeline, integrated into a semantic‑zooming dashboard.
Novelty — What is new about this work?
First to combine semantic zooming with SBEB for supply‑chain flow visualization, providing a unified, multi‑scale interface that preserves spatial context while reducing clutter, and enabling actionable insights that are not visible in traditional single‑scale visualizations.
Limitations — What are the limitations of this study?
- Evaluation limited to a single month and four warehouses, so generalizability to larger, multi‑provider networks is uncertain
- Parameter settings (grid resolution, detour thresholds) were tuned for this dataset, requiring re‑tuning for other contexts
Future Work — What did the authors propose for future work?
- Incorporate temporal dynamics via time sliders or small‑multiple views to observe flow evolution
- Scale the bundling algorithm to thousands of OD pairs using GPU acceleration or hierarchical pre‑aggregation
Paper Details
How to Cite This Paper
@article{limbasia2026semantic,
title = {Semantic Zooming and Edge Bundling for Multi-Scale Supply Chain Flow Visualization},
author = {Limbasia, Bhargav and Qu, Kaixuan and Sun, Keer and others},
year = {2026},
eprint = {2604.08823},
archivePrefix = {arXiv},
primaryClass = {cs.HC},
}
Limbasia, B., Qu, K., Sun, K., Nocera, L., & Li, S. (2026). Semantic Zooming and Edge Bundling for Multi-Scale Supply Chain Flow Visualization. arXiv. https://arxiv.org/abs/2604.08823
Limbasia, Bhargav, et al. "Semantic Zooming and Edge Bundling for Multi-Scale Supply Chain Flow Visualization." arXiv, 2026, arxiv.org/abs/2604.08823.
PDF Preview
Similar Papers
Found 4 papersEdge-Path Bundling: A Less Ambiguous Edge Bundling Approach
Daniel Archambault, Markus Wallinger, David Auber et al.
Comments (0)