Publication
Metrics
Paper Preview
Abstract
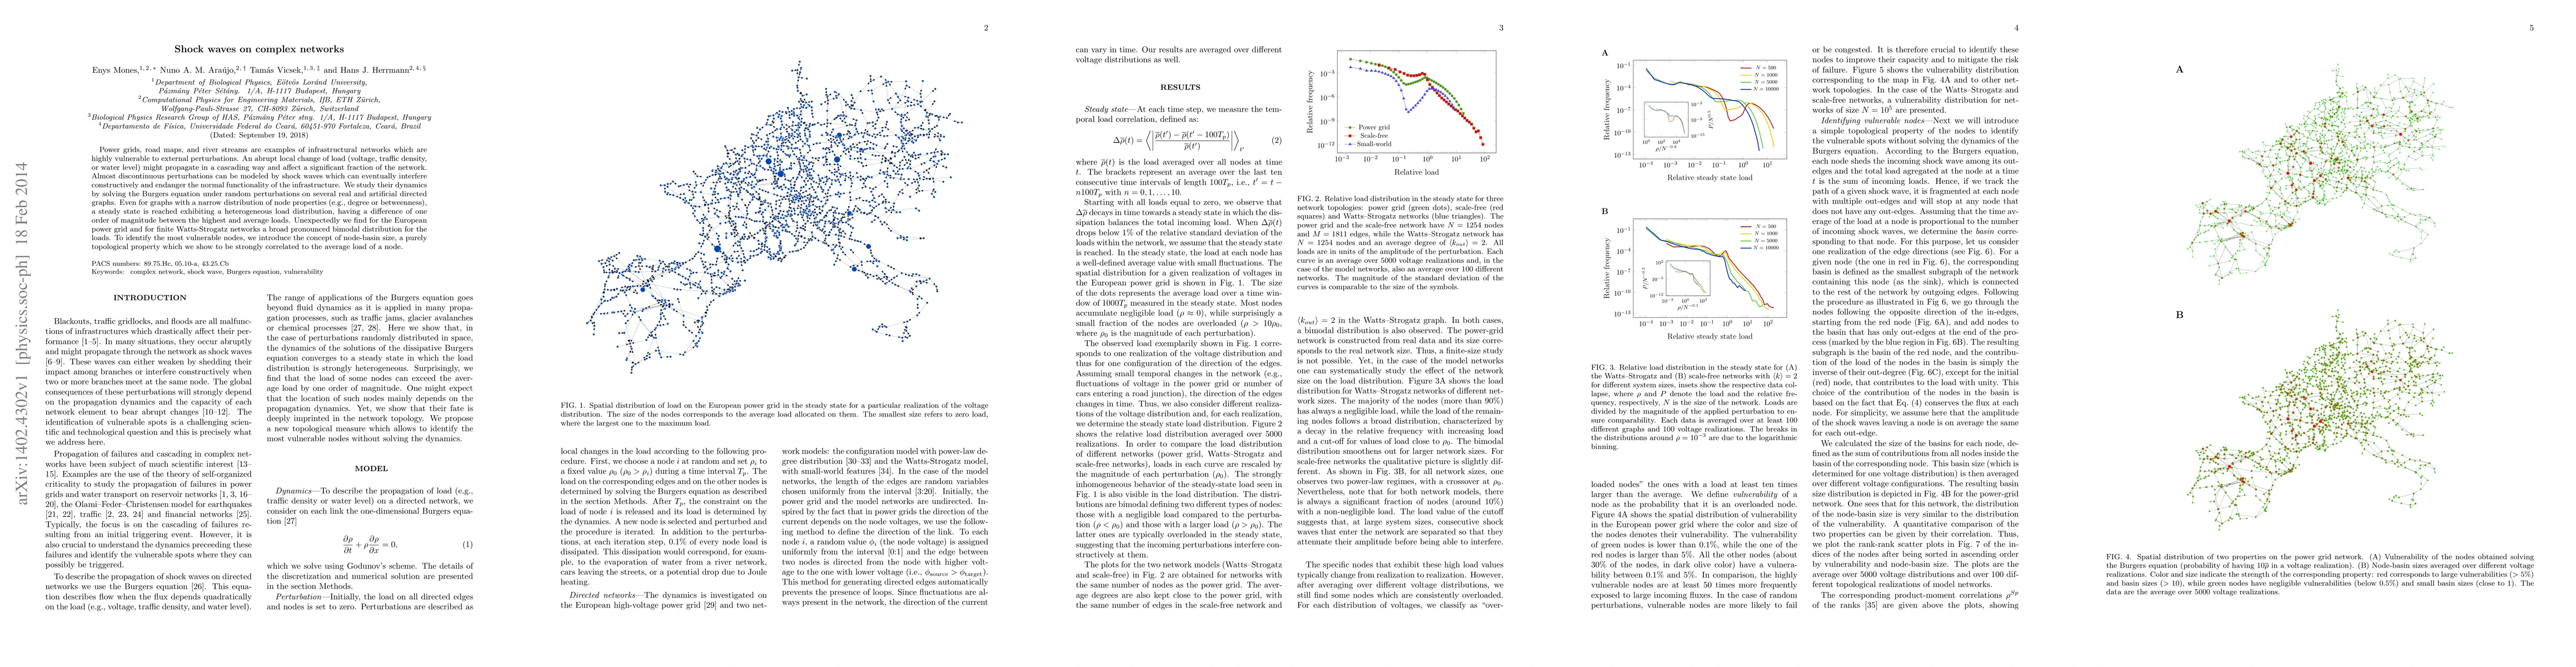
Power grids, road maps, and river streams are examples of infrastructural networks which are highly vulnerable to external perturbations. An abrupt local change of load (voltage, traffic density, or water level) might propagate in a cascading way and affect a significant fraction of the network. Almost discontinuous perturbations can be modeled by shock waves which can eventually interfere constructively and endanger the normal functionality of the infrastructure. We study their dynamics by solving the Burgers equation under random perturbations on several real and artificial directed graphs. Even for graphs with a narrow distribution of node properties (e.g., degree or betweenness), a steady state is reached exhibiting a heterogeneous load distribution, having a difference of one order of magnitude between the highest and average loads. Unexpectedly we find for the European power grid and for finite Watts-Strogatz networks a broad pronounced bimodal distribution for the loads. To identify the most vulnerable nodes, we introduce the concept of node-basin size, a purely topological property which we show to be strongly correlated to the average load of a node.
AI Key Findings
Get AI-generated insights about this paper's methodology, results, significance, and more — seven facets brought into focus.
Impact
Paper Details
PDF Preview
Key Terms
Citation Network
Current paper (gray), citations (green), references (blue)
Display is limited for performance on very large graphs.
Discussion 0