Publication
Metrics
Paper Preview
Abstract
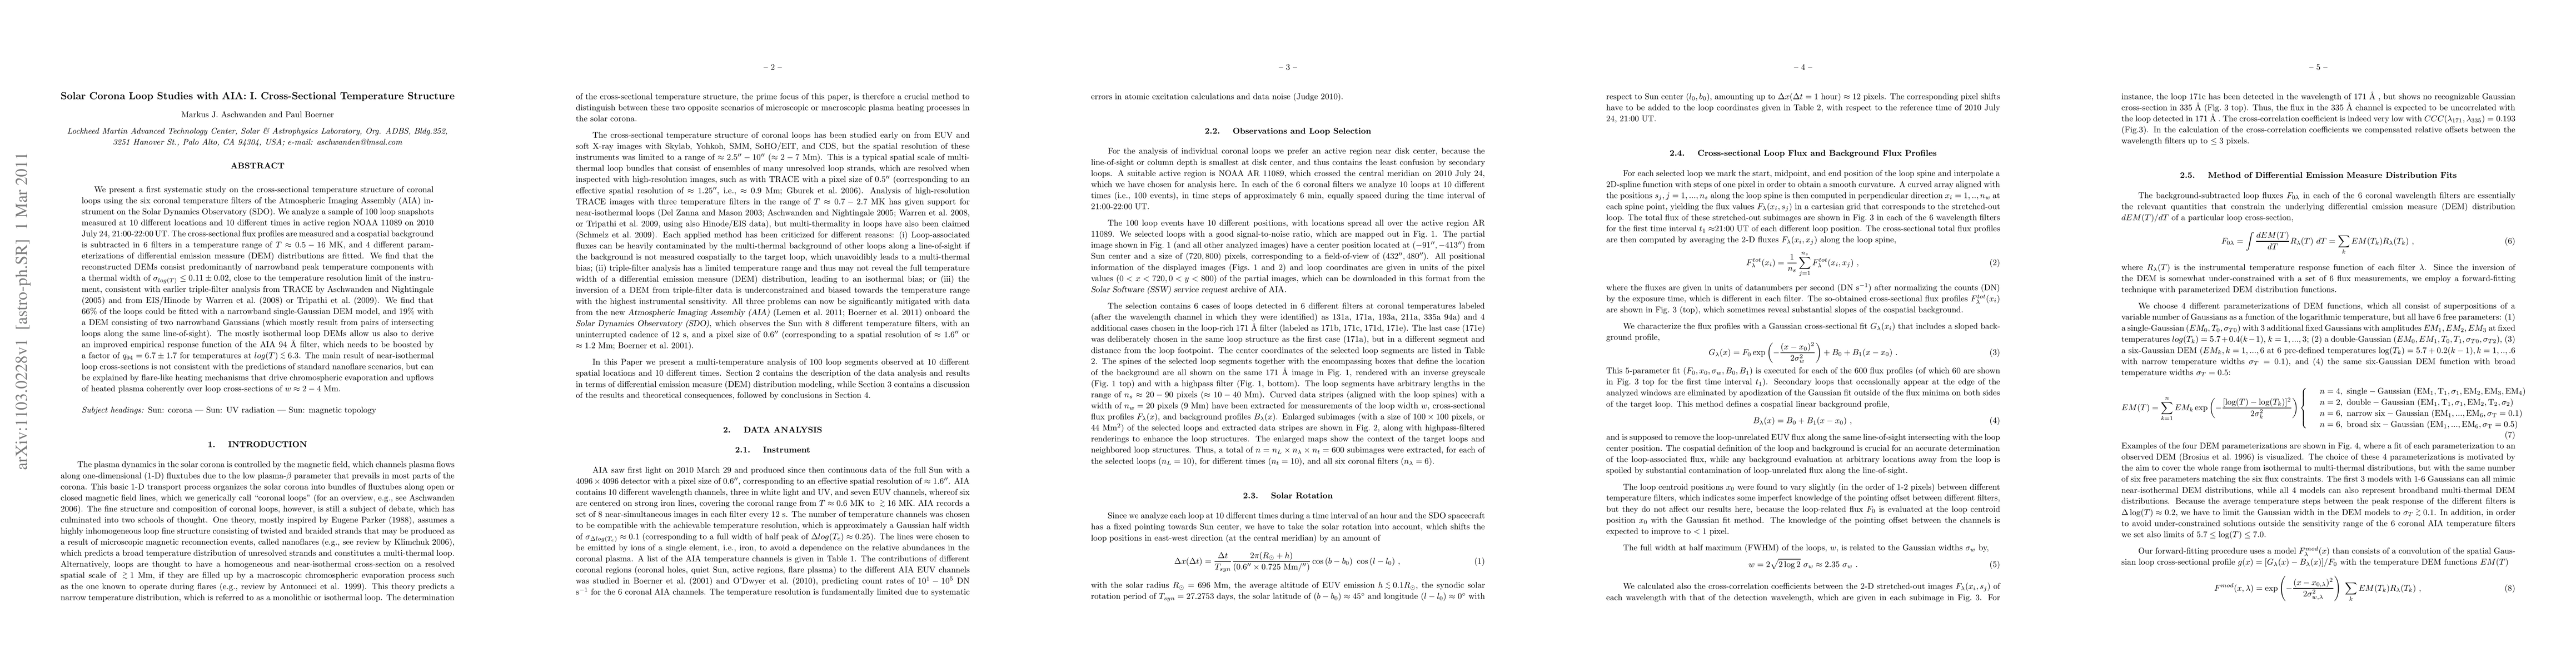
We present a first systematic study on the cross-sectional temperature structure of coronal loops using the six coronal temperature filters of the Atmospheric Imaging Assembly (AIA) instrument on the Solar Dynamics Observatory (SDO). We analyze a sample of 100 loop snapshots measured at 10 different locations and 10 different times in active region NOAA 11089 on 2010 July 24, 21:00-22:00 UT. The cross-sectional flux profiles are measured and a cospatial background is subtracted in 6 filters in a temperature range of $T \approx 0.5-16$ MK, and 4 different parameterizations of differential emission measure (DEM) distributions are fitted. We find that the reconstructed DEMs consist predominantly of narrowband peak temperature components with a thermal width of $\sigma_{log(T)} \le 0.11\pm0.02$, close to the temperature resolution limit of the instrument, consistent with earlier triple-filter analysis from TRACE by Aschwanden and Nightingale (2005) and from EIS/Hinode by Warren et al. (2008) or Tripathi et al. (2009). We find that 66% of the loops could be fitted with a narrowband single-Gaussian DEM model, and 19% with a DEM consisting of two narrowband Gaussians (which mostly result from pairs of intersecting loops along the same line-of-sight). The mostly isothermal loop DEMs allow us also to derive an improved empirical response function of the AIA 94 \ang\ filter, which needs to be boosted by a factor of $q_{94} = 6.7\pm 1.7$ for temperatures at $log(T) \lapprox 6.3$. The main result of near-isothermal loop cross-sections is not consistent with the predictions of standard nanoflare scenarios, but can be explained by flare-like heating mechanisms that drive chromospheric evaporation and upflows of heated plasma coherently over loop cross-sections of $w \approx 2-4$ Mm.
AI Key Findings
Get AI-generated insights about this paper's methodology, results, significance, and more — seven facets brought into focus.
Impact
Paper Details
PDF Preview
Key Terms
Citation Network
Current paper (gray), citations (green), references (blue)
Display is limited for performance on very large graphs.
Discussion 0