Publication
Metrics
AI Quick Summary
This paper analyzes Spotify song popularity in relation to danceability using SAP for visualization and regression. It explores connections between song features like energy, valence, BPM, and release date, alongside danceability, to understand their impact on song popularity.
Paper Preview
Abstract
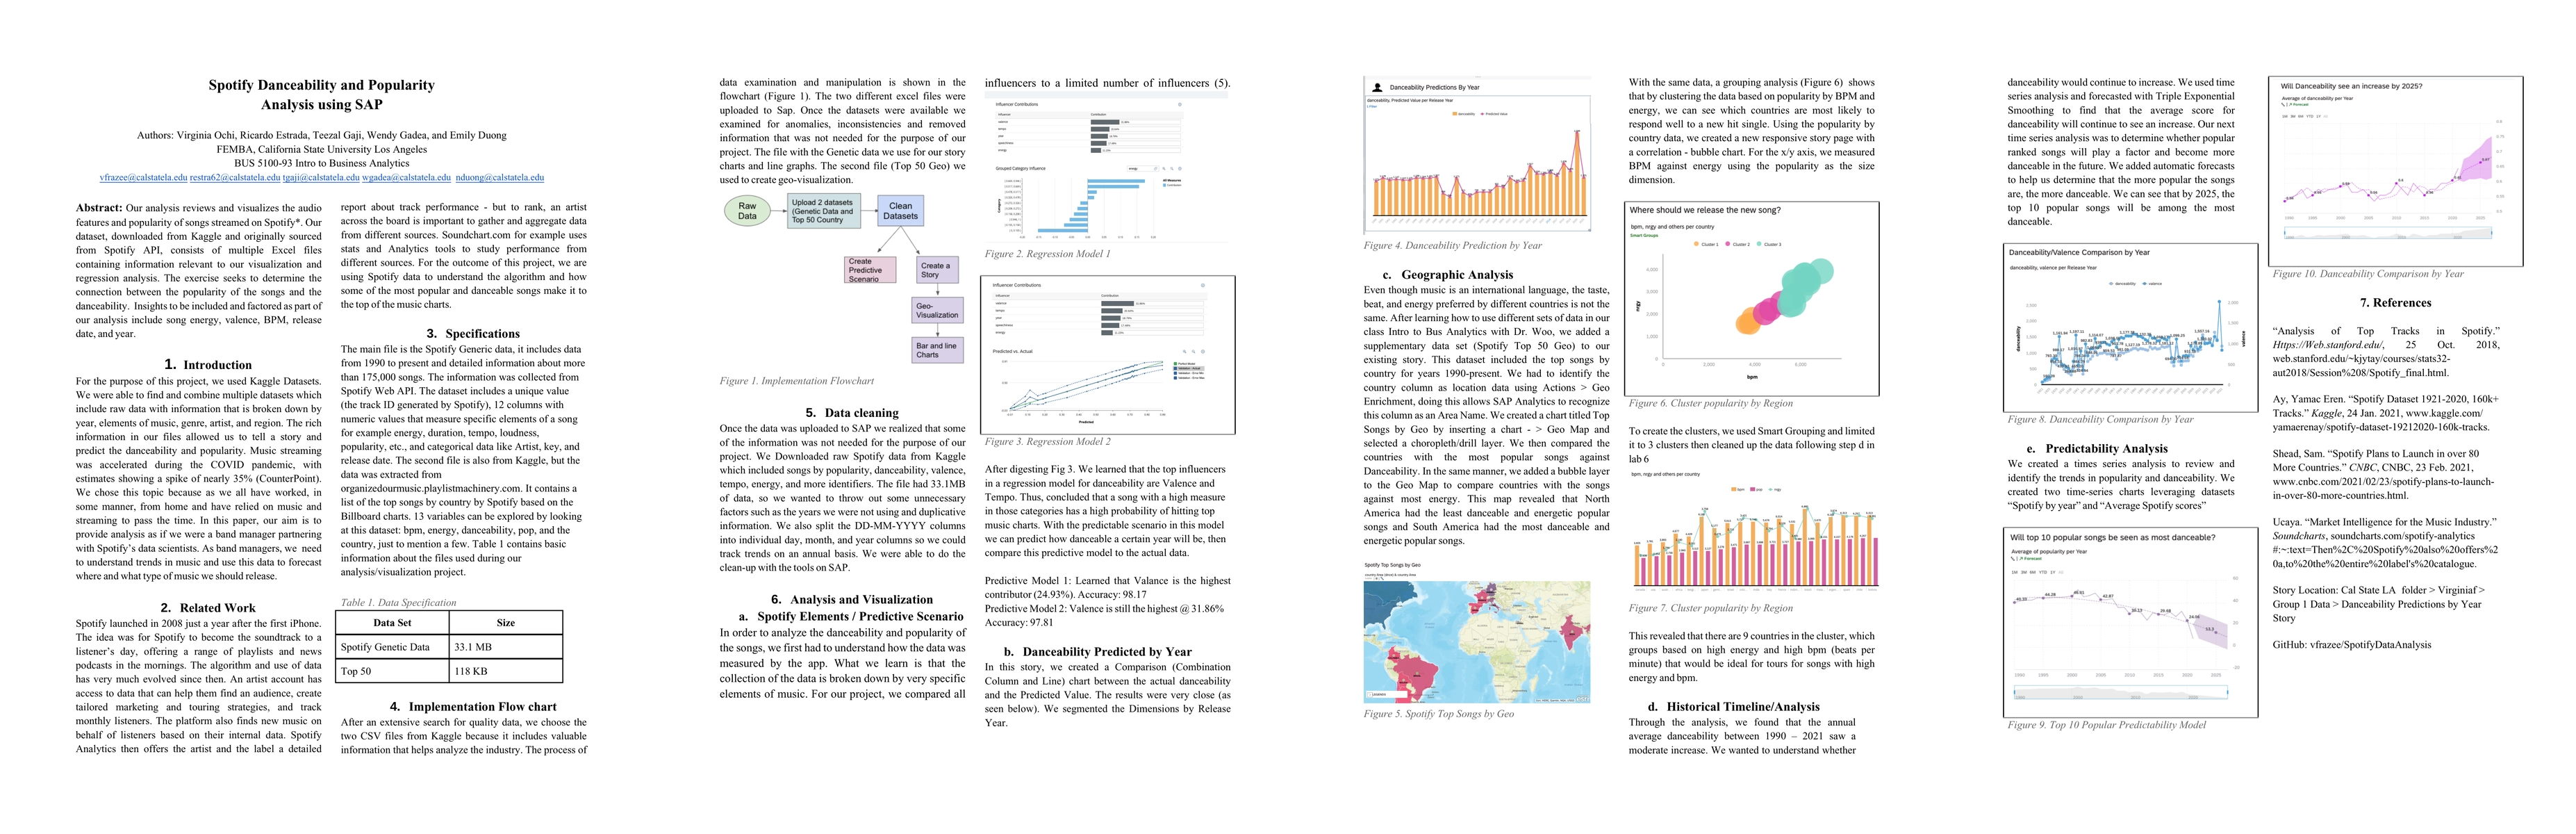
Our analysis reviews and visualizes the audio features and popularity of songs streamed on Spotify*. Our dataset, downloaded from Kaggle and originally sourced from Spotify API, consists of multiple Excel files containing information relevant to our visualization and regression analysis. The exercise seeks to determine the connection between the popularity of the songs and the danceability. Insights to be included and factored as part of our analysis include song energy, valence, BPM, release date, and year.
AI Key Findings
Get AI-generated insights about this paper's methodology, results, significance, and more — seven facets brought into focus.
Impact
Paper Details
Authors
PDF Preview
Key Terms
Citation Network
Current paper (gray), citations (green), references (blue)
Display is limited for performance on very large graphs.
Discussion 0