Publication
Metrics
AI Quick Summary
This paper introduces a GPU-based framework for analyzing and visualizing terabyte-sized 3D astronomical images, achieving speeds 10-100 times faster than traditional CPU methods. The framework demonstrates efficient processing of large datasets, with scalability to images up to 1 TB and beyond.
Paper Preview
Abstract
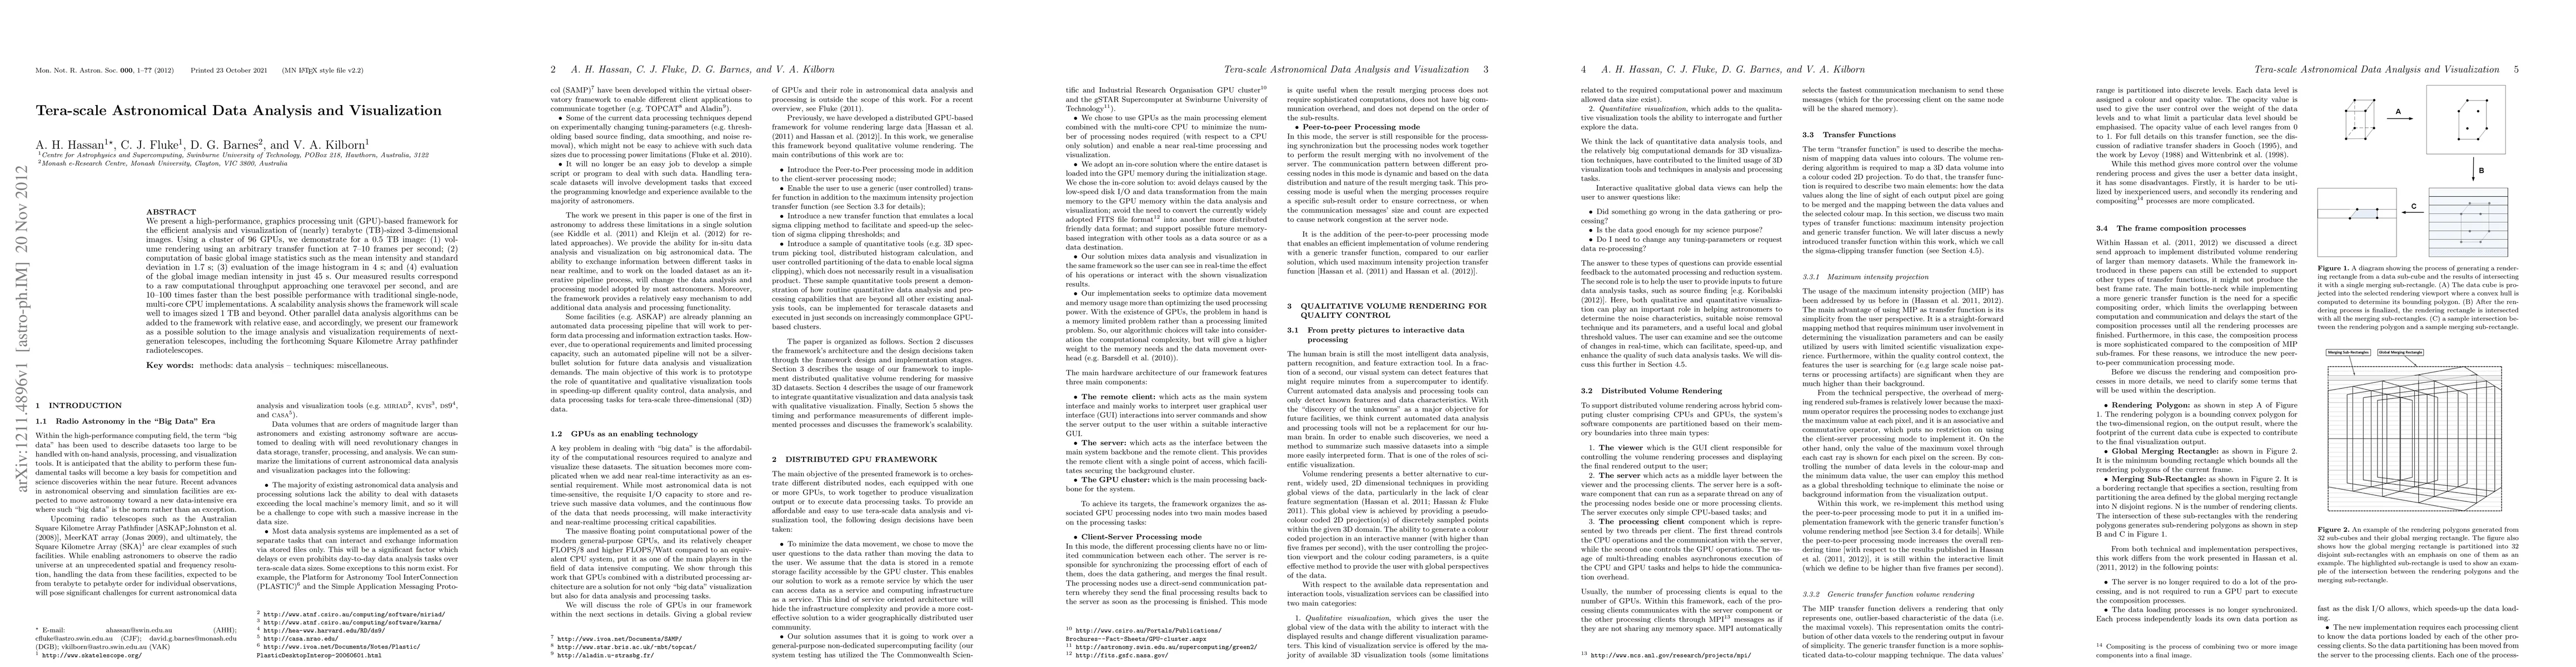
We present a high-performance, graphics processing unit (GPU)-based framework for the efficient analysis and visualization of (nearly) terabyte (TB)-sized 3-dimensional images. Using a cluster of 96 GPUs, we demonstrate for a 0.5 TB image: (1) volume rendering using an arbitrary transfer function at 7--10 frames per second; (2) computation of basic global image statistics such as the mean intensity and standard deviation in 1.7 s; (3) evaluation of the image histogram in 4 s; and (4) evaluation of the global image median intensity in just 45 s. Our measured results correspond to a raw computational throughput approaching one teravoxel per second, and are 10--100 times faster than the best possible performance with traditional single-node, multi-core CPU implementations. A scalability analysis shows the framework will scale well to images sized 1 TB and beyond. Other parallel data analysis algorithms can be added to the framework with relative ease, and accordingly, we present our framework as a possible solution to the image analysis and visualization requirements of next-generation telescopes, including the forthcoming Square Kilometre Array pathfinder radiotelescopes.
AI Key Findings
Get AI-generated insights about this paper's methodology, results, significance, and more — seven facets brought into focus.
Impact
Paper Details
PDF Preview
Key Terms
Citation Network
Current paper (gray), citations (green), references (blue)
Display is limited for performance on very large graphs.
Discussion 0