01
MethodologyHow they did it
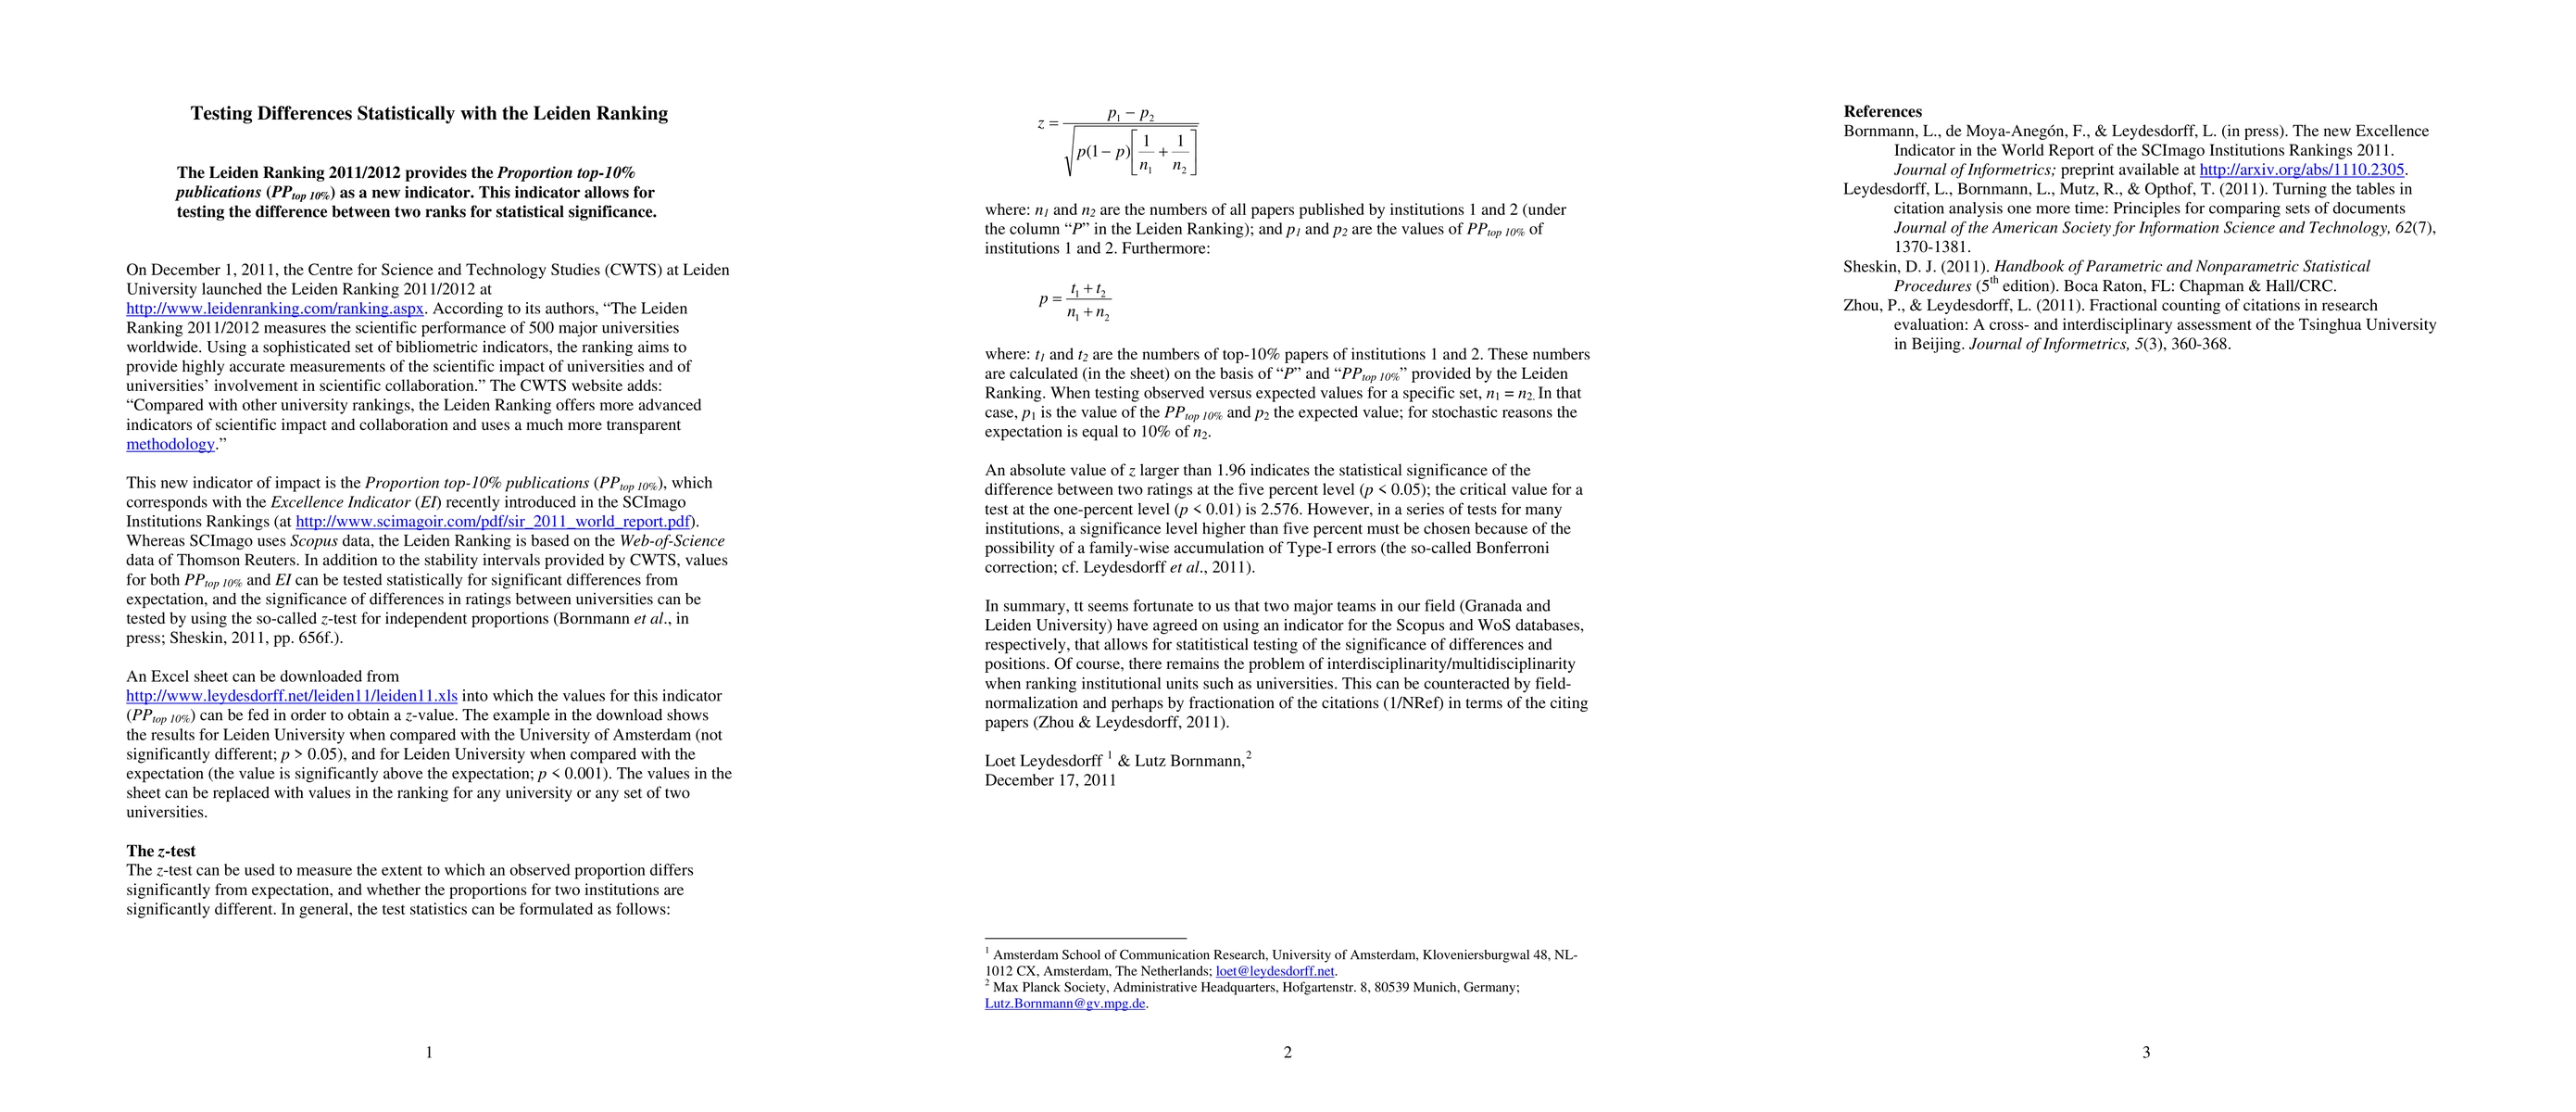
The research utilizes the Leiden Ranking 2011/2012, which introduces the Proportion top-10% publications (PPtop 10%) as a new indicator for measuring scientific performance. This indicator allows for statistical testing of differences in rankings using the z-test for independent proportions.
Discussion 0