01
MethodologyHow they did it
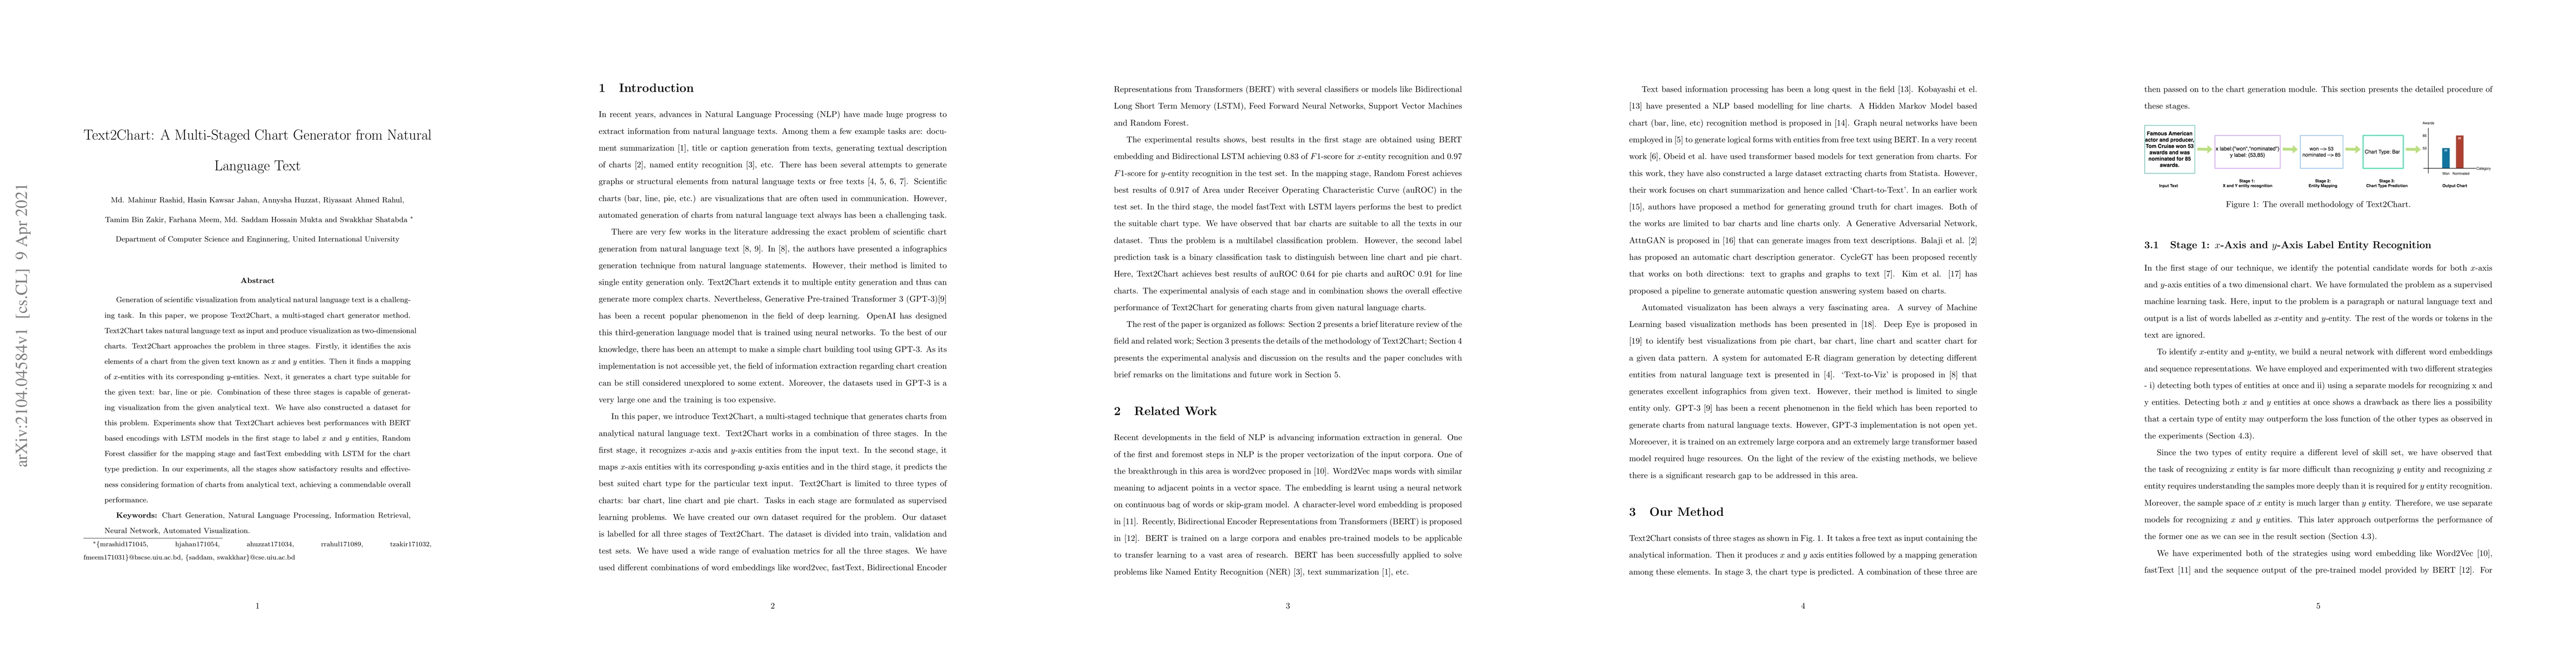
Text2Chart utilizes a multi-staged approach with automatic chart generation from human-written analytical text.
Text2Chart is a multi-staged chart generator that converts analytical natural language text into two-dimensional visualizations by identifying x and y entities, mapping them, and selecting appropriate chart types like bar, line, or pie. Experiments demonstrate its effectiveness using BERT, LSTM, Random Forest, and fastText.
Text2Chart is a multi-staged chart generator that converts analytical natural language text into two-dimensional visualizations by identifying x and y entities, mapping them, and selecting appropriate chart types like bar, line, or pie. Experiments demonstrate its effectiveness using BERT, LSTM, Random Forest, and fastText.
Text2Chart utilizes a multi-staged approach with automatic chart generation from human-written analytical text. More in Methodology →
Main finding 1: Text2Chart provides satisfactory results in every stage of automatic chart generation. — Main finding 2: The technique has been tested on a curated dataset and demonstrates promising performance. More in Key Results →
Text2Chart contributes to the development of automatic chart generation from text, which is essential for data visualization and communication. More in Significance →
Limitation 1: The current dataset size limits the scope of the research. — Limitation 2: The technique is currently limited to predicting only three basic chart types (bar charts, pie charts, and line charts). More in Limitations →
Generation of scientific visualization from analytical natural language text is a challenging task. In this paper, we propose Text2Chart, a multi-staged chart generator method. Text2Chart takes natural language text as input and produce visualization as two-dimensional charts. Text2Chart approaches the problem in three stages. Firstly, it identifies the axis elements of a chart from the given text known as x and y entities. Then it finds a mapping of x-entities with its corresponding y-entities. Next, it generates a chart type suitable for the given text: bar, line or pie. Combination of these three stages is capable of generating visualization from the given analytical text. We have also constructed a dataset for this problem. Experiments show that Text2Chart achieves best performances with BERT based encodings with LSTM models in the first stage to label x and y entities, Random Forest classifier for the mapping stage and fastText embedding with LSTM for the chart type prediction. In our experiments, all the stages show satisfactory results and effectiveness considering formation of charts from analytical text, achieving a commendable overall performance.
Seven facets of this paper, analysed and brought into focus by AI.
Text2Chart contributes to the development of automatic chart generation from text, which is essential for data visualization and communication.
Text2Chart utilizes a multi-staged approach with automatic chart generation from human-written analytical text.
Text2Chart contributes to the development of automatic chart generation from text, which is essential for data visualization and communication.
Text2Chart presents a novel approach to automatic chart generation from text, utilizing a multi-staged technique and leveraging pre-trained encoders.
The work differs from existing research by its focus on automatic chart generation from human-written analytical text, which is a unique application of natural language processing techniques.
Current paper (gray), citations (green), references (blue)
Display is limited for performance on very large graphs.
Discussion 0