Publication
Metrics
AI Quick Summary
The paper introduces a method for improving statistical graphics by using a "ladder of abstraction," starting with simple plots and gradually embedding them into more general frameworks. It demonstrates this approach through two examples involving modeled trajectories and income-voting analysis.
Paper Preview
Abstract
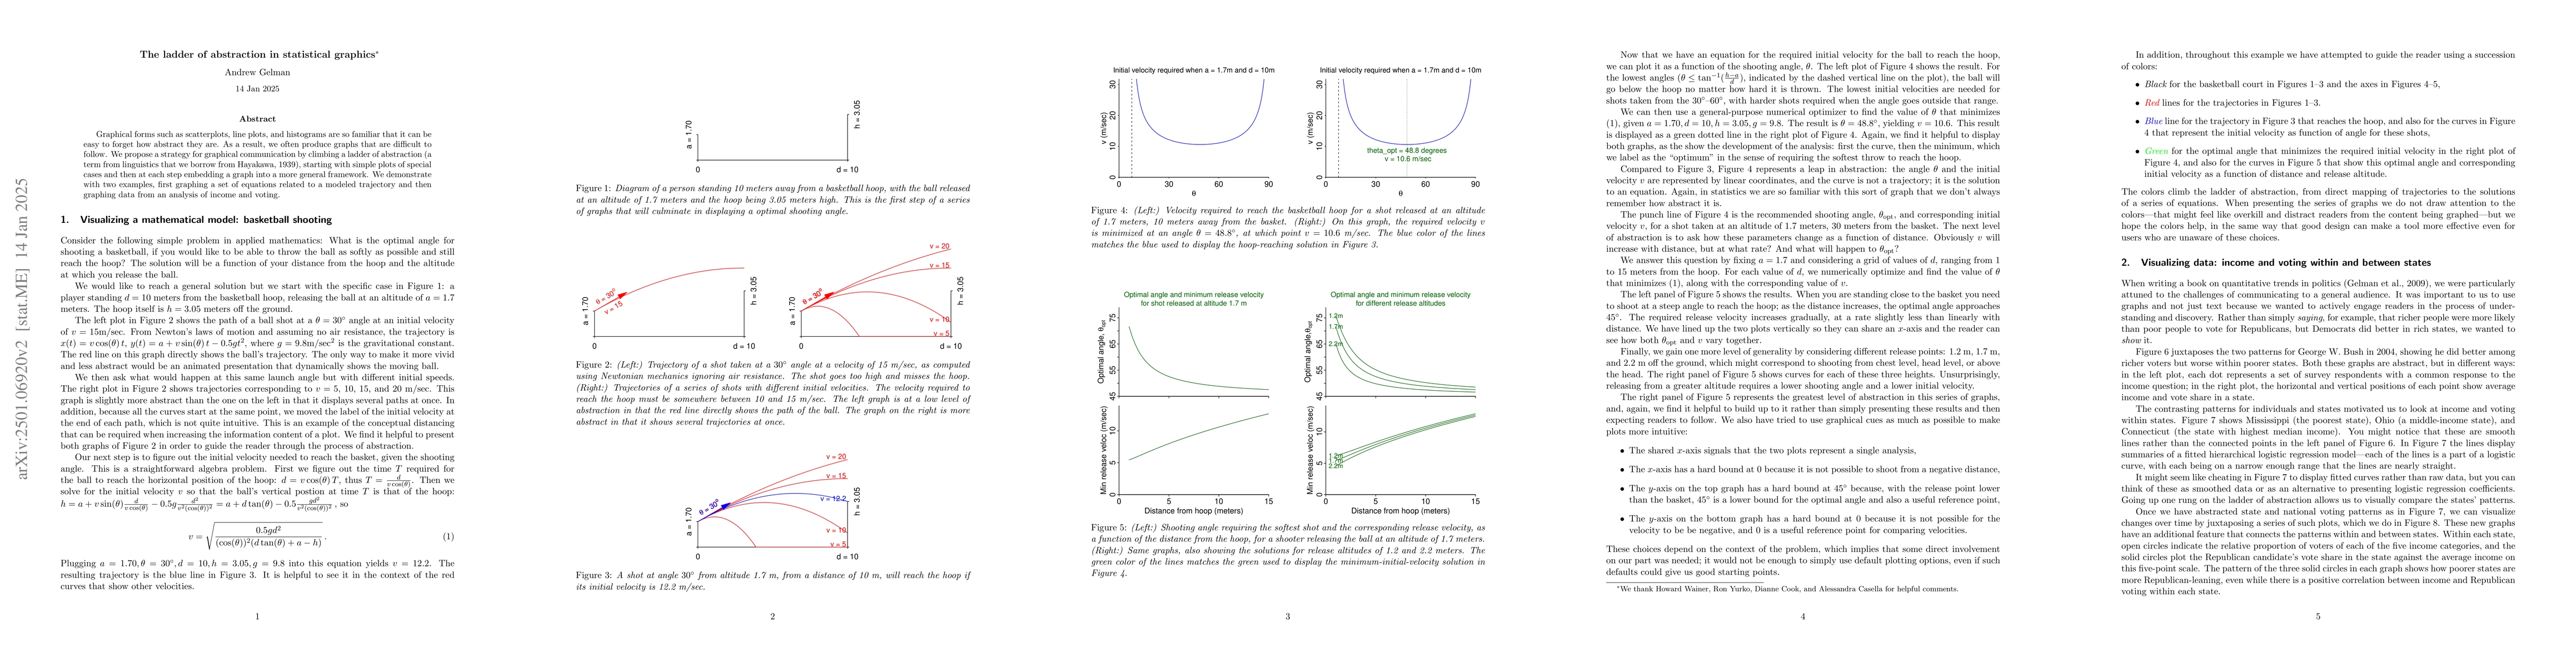
Graphical forms such as scatterplots, line plots, and histograms are so familiar that it can be easy to forget how abstract they are. As a result, we often produce graphs that are difficult to follow. We propose a strategy for graphical communication by climbing a ladder of abstraction (a term from linguistics that we borrow from Hayakawa, 1939), starting with simple plots of special cases and then at each step embedding a graph into a more general framework. We demonstrate with two examples, first graphing a set of equations related to a modeled trajectory and then graphing data from an analysis of income and voting.
AI Key Findings
Get AI-generated insights about this paper's methodology, results, significance, and more — seven facets brought into focus.
Impact
Paper Details
Authors
PDF Preview
Citation Network
Current paper (gray), citations (green), references (blue)
Display is limited for performance on very large graphs.
Discussion 0