Publication
Metrics
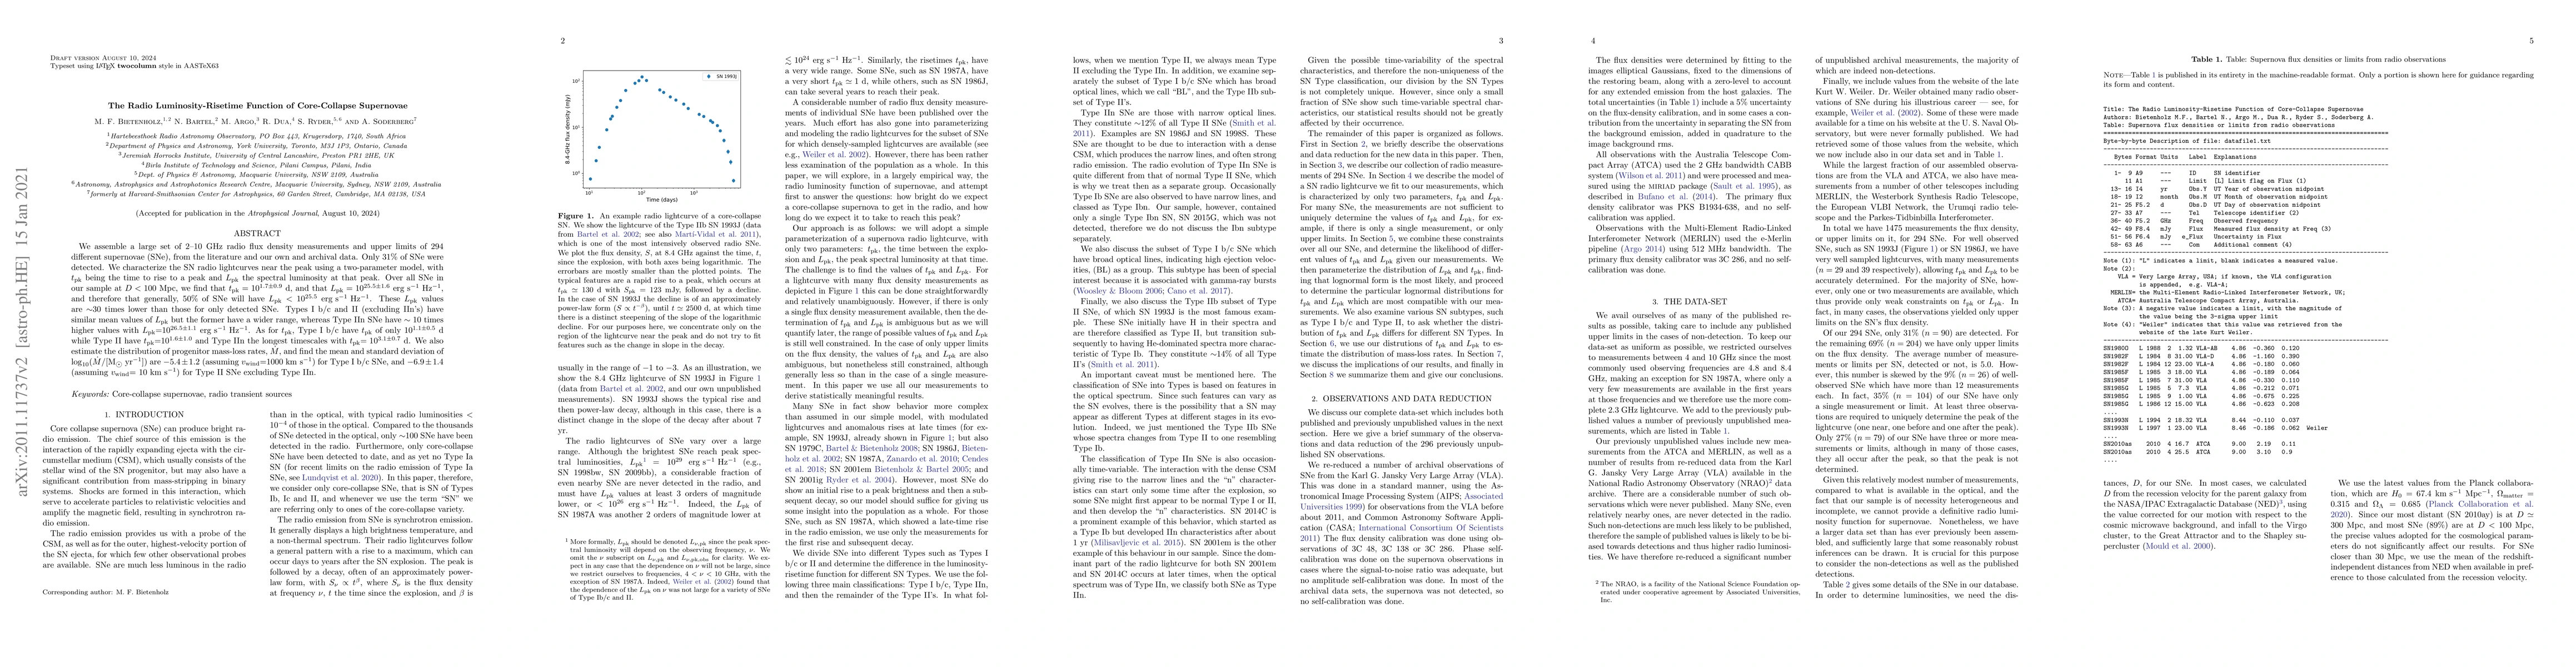
Paper Preview
Abstract
We assemble a large set of 2-10 GHz radio flux density measurements and upper limits of 294 different supernovae (SNe), from the literature and our own and archival data. Only 31% of the SNe were detected. We characterize the SN lightcurves near the peak using a two-parameter model, with $t_{\rm pk}$ being the time to rise to a peak and $L_{\rm pk}$ the spectral luminosity at that peak. Over all SNe in our sample at $D<100$ Mpc, we find that $t_{\rm pk} = 10^{1.7\pm0.9}$ d, and that $L_{\rm pk} = 10^{25.5\pm1.6}$ erg s$^{-1}$ Hz$^{-1}$, and therefore that generally, 50% of SNe will have $L_{\rm pk} < 10^{25.5}$ erg s$^{-1}$ Hz$^{-1}$. These $L_{\rm pk}$ values are ~30 times lower than those for only detected SNe. Types I b/c and II (excluding IIn's) have similar mean values of $L_{\rm pk}$ but the former have a wider range, whereas Type IIn SNe have ~10 times higher values with $L_{\rm pk} = 10^{26.5\pm1.1}$ erg s$^{-1}$ Hz$^{-1}$. As for $t_{\rm pk}$, Type I b/c have $t_{\rm pk}$ of only $10^{1.1\pm0.5}$ d while Type II have $t_{\rm pk} = 10^{1.6\pm1.0}$ and Type IIn the longest timescales with $t_{\rm pk} = 10^{3.1\pm0.7}$ d. We also estimate the distribution of progenitor mass-loss rates, $\dot M$, and find the mean and standard deviation of log$_{10}(\dot M/$Msol) yr$^{-1}$ are $-5.4\pm1.2$ (assuming $v_{\rm wind}=1000$ km s$^{-1}$) for Type I~b/c SNe, and $-6.9\pm1.4$ (assuming $v_{\rm wind} = 10$ km s$^{-1}$ for Type II SNe excluding Type IIn.
AI Key Findings
Get AI-generated insights about this paper's methodology, results, significance, and more — seven facets brought into focus.
Impact
Paper Details
Authors
PDF Preview
Key Terms
Citation Network
Current paper (gray), citations (green), references (blue)
Display is limited for performance on very large graphs.
Discussion 0