Publication
Metrics
AI Quick Summary
Researchers developed a method to analyze the Milky Way's vertical potential, stellar motion, and phase space distribution function using Gaia Data Release 2, finding a spiral pattern in the data that suggests a 540 Myr year-old perturbation.
Paper Preview
Abstract
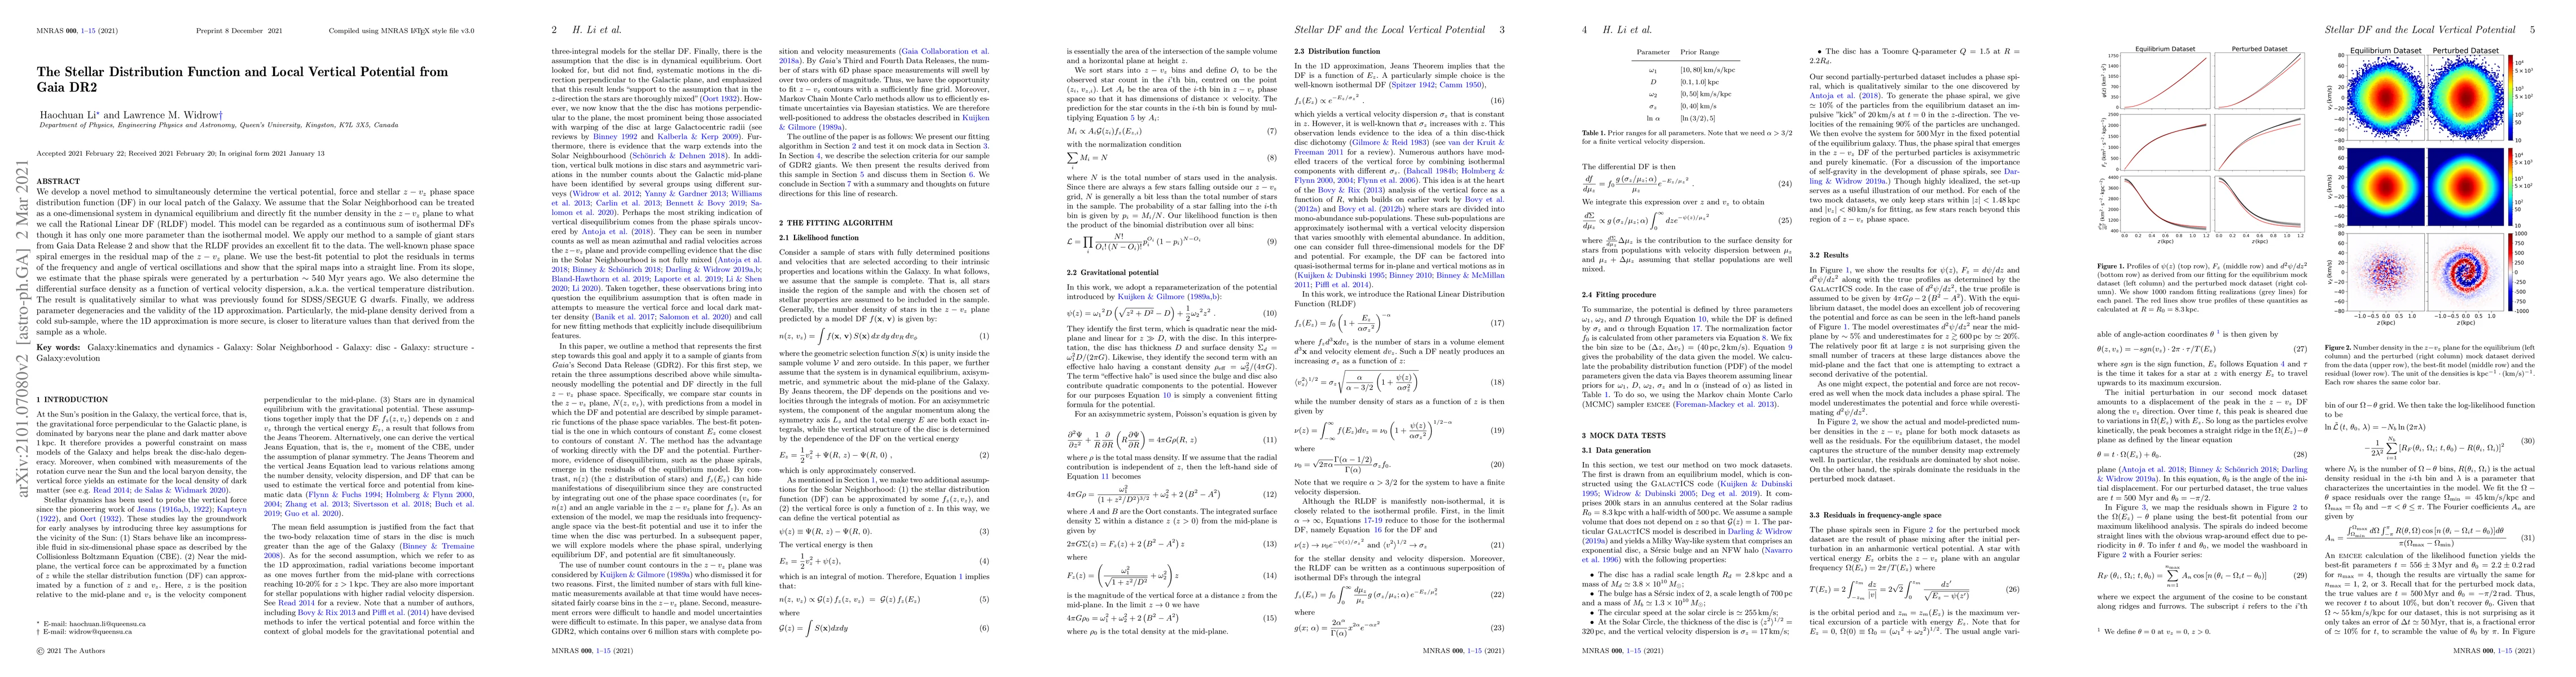
We develop a novel method to simultaneously determine the vertical potential, force and stellar $z-v_z$ phase space distribution function (DF) in our local patch of the Galaxy. We assume that the Solar Neighborhood can be treated as a one-dimensional system in dynamical equilibrium and directly fit the number density in the $z-v_z$ plane to what we call the Rational Linear DF (RLDF) model. This model can be regarded as a continuous sum of isothermal DFs though it has only one more parameter than the isothermal model. We apply our method to a sample of giant stars from Gaia Data Release 2 and show that the RLDF provides an excellent fit to the data. The well-known phase space spiral emerges in the residual map of the $z-v_z$ plane. We use the best-fit potential to plot the residuals in terms of the frequency and angle of vertical oscillations and show that the spiral maps into a straight line. From its slope, we estimate that the phase spirals were generated by a perturbation $\sim540$ Myr years ago. We also determine the differential surface density as a function of vertical velocity dispersion, a.k.a. the vertical temperature distribution. The result is qualitatively similar to what was previously found for SDSS/SEGUE G dwarfs. Finally, we address parameter degeneracies and the validity of the 1D approximation. Particularly, the mid-plane density derived from a cold subsample, where the 1D approximation is more secure, is closer to literature values than that derived from the sample as a whole.
AI Key Findings
Get AI-generated insights about this paper's methodology, results, significance, and more — seven facets brought into focus.
Impact
Paper Details
PDF Preview
Key Terms
Citation Network
Current paper (gray), citations (green), references (blue)
Display is limited for performance on very large graphs.
Discussion 0