Towards a Rigorous Evaluation of Explainability for Multivariate Time Series
Publication
Metrics
AI Quick Summary
This study develops and evaluates model agnostic explainability techniques, LIME and SHAP, for time series forecasting to help a digital consultancy understand the impact of sales activities. The results show that these methods significantly aid human comprehension of the model's predictions.
Paper Preview
Abstract
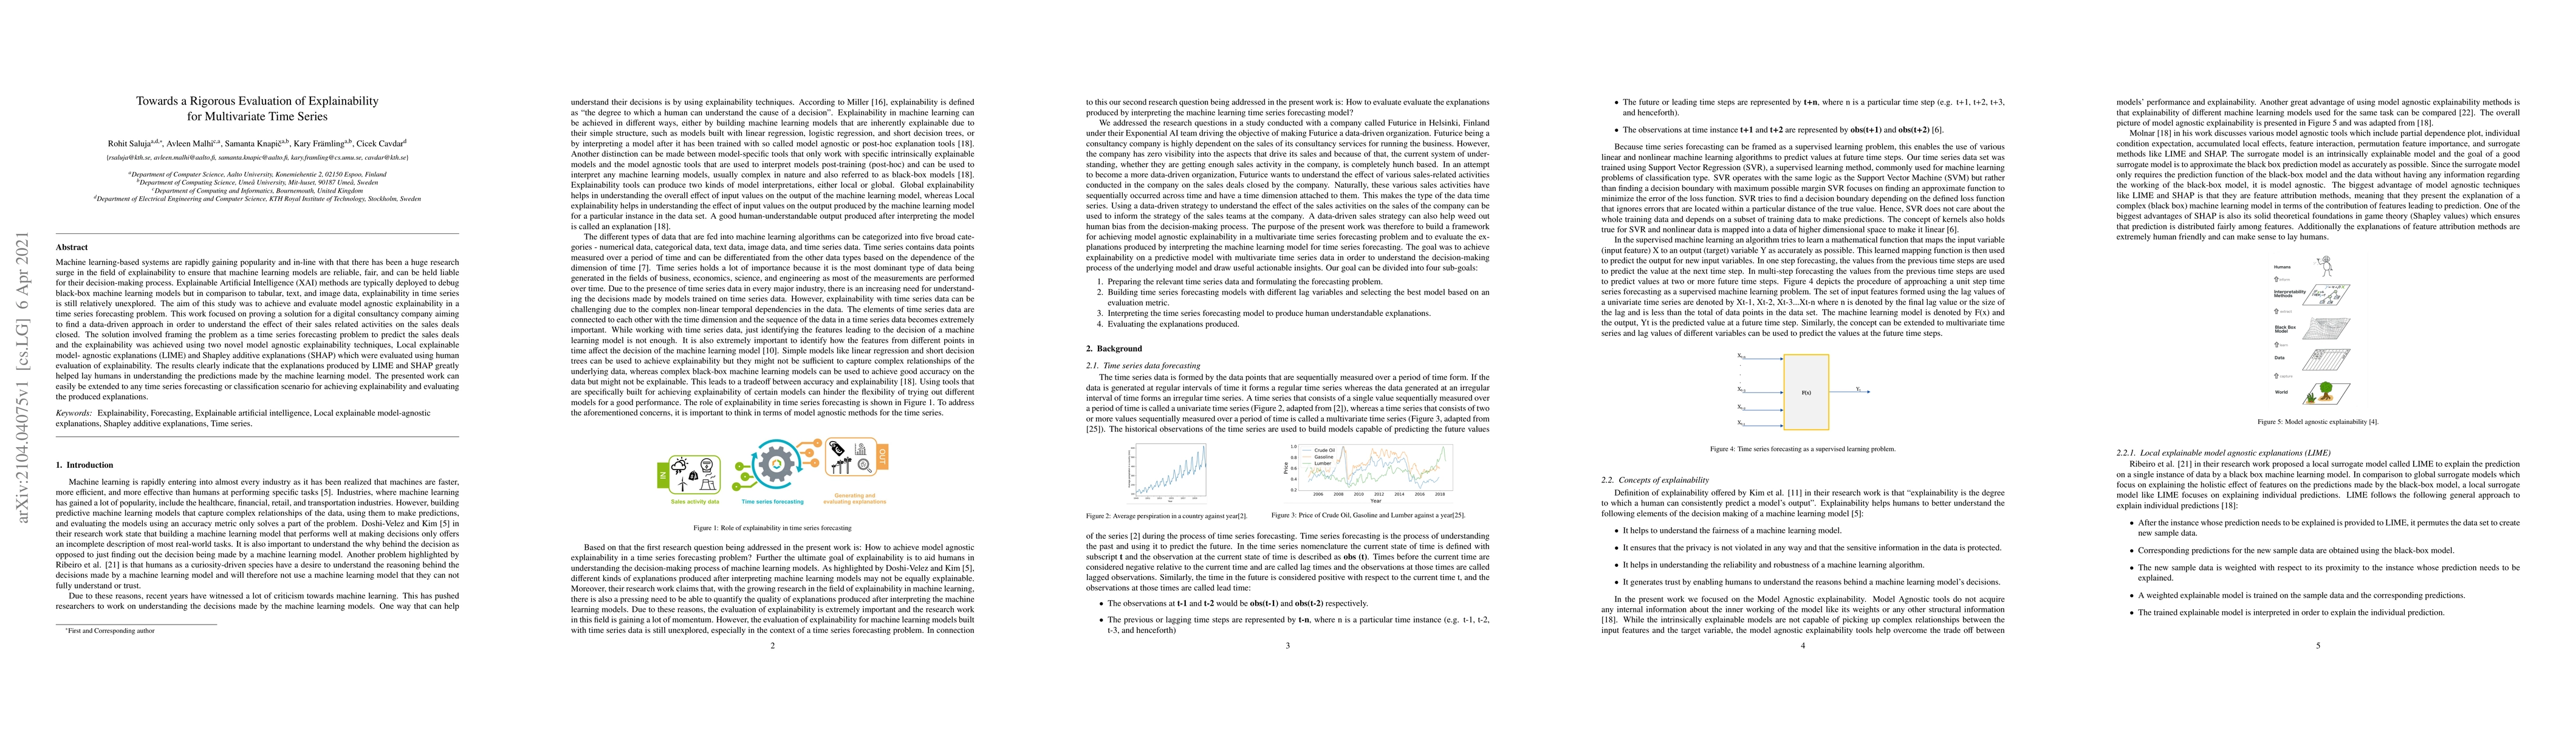
Machine learning-based systems are rapidly gaining popularity and in-line with that there has been a huge research surge in the field of explainability to ensure that machine learning models are reliable, fair, and can be held liable for their decision-making process. Explainable Artificial Intelligence (XAI) methods are typically deployed to debug black-box machine learning models but in comparison to tabular, text, and image data, explainability in time series is still relatively unexplored. The aim of this study was to achieve and evaluate model agnostic explainability in a time series forecasting problem. This work focused on proving a solution for a digital consultancy company aiming to find a data-driven approach in order to understand the effect of their sales related activities on the sales deals closed. The solution involved framing the problem as a time series forecasting problem to predict the sales deals and the explainability was achieved using two novel model agnostic explainability techniques, Local explainable model-agnostic explanations (LIME) and Shapley additive explanations (SHAP) which were evaluated using human evaluation of explainability. The results clearly indicate that the explanations produced by LIME and SHAP greatly helped lay humans in understanding the predictions made by the machine learning model. The presented work can easily be extended to any time
AI Key Findings
Get AI-generated insights about this paper's methodology, results, significance, and more — seven facets brought into focus.
Impact
Paper Details
Authors
PDF Preview
Key Terms
Citation Network
Current paper (gray), citations (green), references (blue)
Display is limited for performance on very large graphs.
Discussion 0