ArxivLens
ArXiv stat.OT stat.AP

Tutorial on principal component analysis, with applications in R

Henk van Elst

2112.12067 DOI: 10.13140/RG.2.2.20075.16168/2 Published Dec 24, 2021
View PDF

Publication

Published: Dec 24, 2021
Categories: stat.OT, stat.AP

Metrics

Source: ArXiv

AI Quick Summary

This tutorial provides a comprehensive overview of principal component analysis (PCA) for multivariate data, focusing on its application for dimensionality reduction and utilizing R for computational demonstrations. Practical examples and R code are provided to facilitate understanding.

Quick Answers

What is "Tutorial on principal component analysis, with applications in R" about?

This tutorial provides a comprehensive overview of principal component analysis (PCA) for multivariate data, focusing on its application for dimensionality reduction and utilizing R for computational demonstrations. Practical examples and R code are provided to facilitate understanding.

What methodology did the authors use?

Brief description of the research methodology used More in Methodology →

What are the key results?

Main finding 1: Dimensionally reduced dataset explains 57.94% of total variance. — Main finding 2: Bivariate correlations between original variables reach maximal/minimal values. More in Key Results →

Why is this work significant?

Why this research is important and its potential impact More in Significance →

What are the main limitations?

Limitation 1: Extreme case of dimensionality reduction. — Limitation 2: Potential loss of information in reduced dataset. More in Limitations →

Paper Preview

Abstract

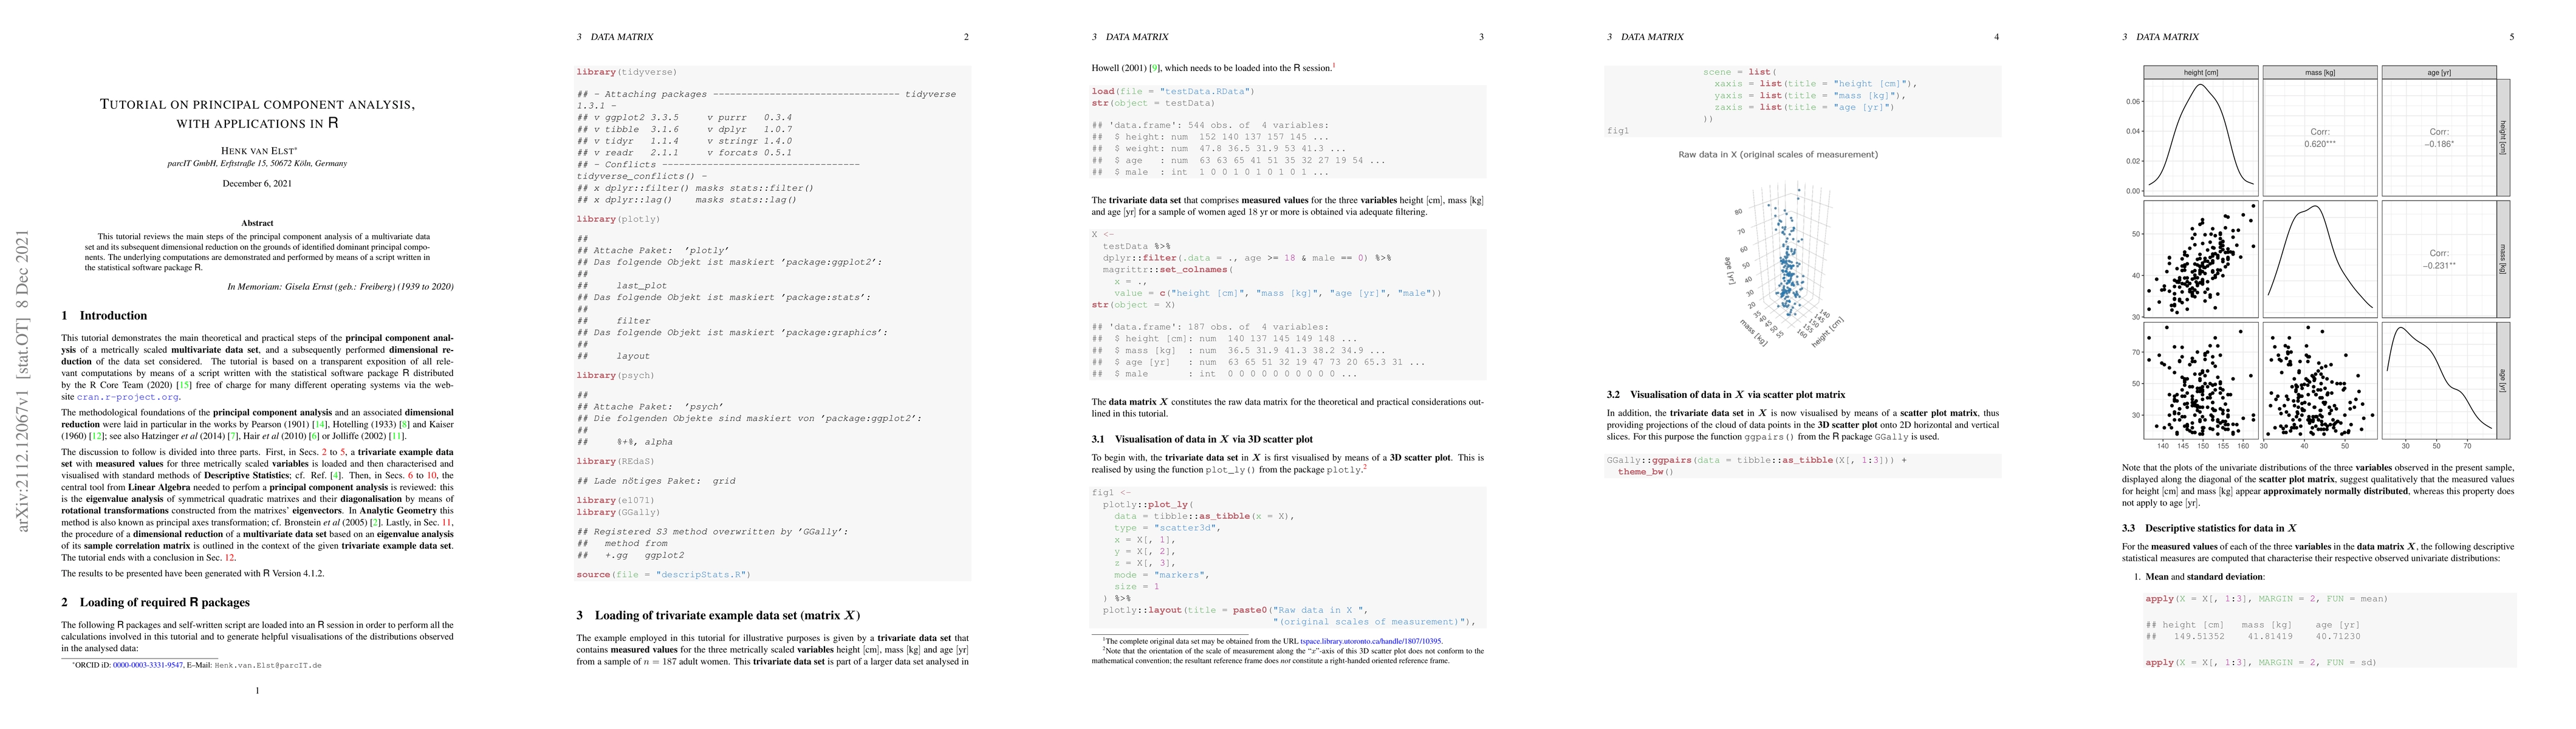
This tutorial reviews the main steps of the principal component analysis of a multivariate data set and its subsequent dimensional reduction on the grounds of identified dominant principal components. The underlying computations are demonstrated and performed by means of a script written in the statistical software package R.

Key Findings, in focus

Seven facets of this paper, analysed and brought into focus by AI.

AI-generated · verify against source Generated Sep 04, 2025
In focus · one-line synthesis

Why this research is important and its potential impact

01
MethodologyHow they did it

Brief description of the research methodology used

02
ResultsWhat they found
  • Main finding 1: Dimensionally reduced dataset explains 57.94% of total variance.
  • Main finding 2: Bivariate correlations between original variables reach maximal/minimal values.
  • Main finding 3: Reduced dataset exhibits maximal possible values for bivariate correlations.
03
SignificanceWhy it matters

Why this research is important and its potential impact

04
Technical ContributionsWhat's new technically

Main technical or theoretical contribution

05
NoveltyWhat sets it apart

What makes this work novel or different from existing research

06
LimitationsWhat to be cautious about
  • Limitation 1: Extreme case of dimensionality reduction.
  • Limitation 2: Potential loss of information in reduced dataset.
07
Future WorkWhere it goes next
  • Suggested direction 1: Investigate applicability to other datasets.
  • Suggested direction 2: Explore methods for handling missing values.

Impact

16
References

Paper Details

Paper ID: 2112.12067
License: http://creativecommons.org/licenses/by/4.0/
Comments: 37 pages, 6 *.png figures, 10 *.pdf figures, LaTeX2e, hyperlinked references
Categories:
stat.OT stat.AP

How to Cite This Paper

Reference manager: RIS EndNote

Key Terms

principal (0.380)
principal (0.352)
reviews (0.258)
principal component (0.249)
reviews (0.244)
package (0.244)
multivariate (0.238)
data set (0.236)

Citation Network

Current paper (gray), citations (green), references (blue)

Display is limited for performance on very large graphs.

Current Paper
Citations
References
Click to view


Discussion 0

This website uses cookies to ensure you get the best experience. Learn more