Understanding Internet of Things Malware by Analyzing Endpoints in their Static Artifacts
Publication
Metrics
AI Quick Summary
This paper analyzes IoT malware by examining endpoints reachable on the public Internet, focusing on dropzones and their target IP addresses. Through reverse-engineering of 2,423 malware samples and data from public scanners, it reveals insights into the dynamics of the IoT malware ecosystem, aiding in future defense strategies.
Paper Preview
Abstract
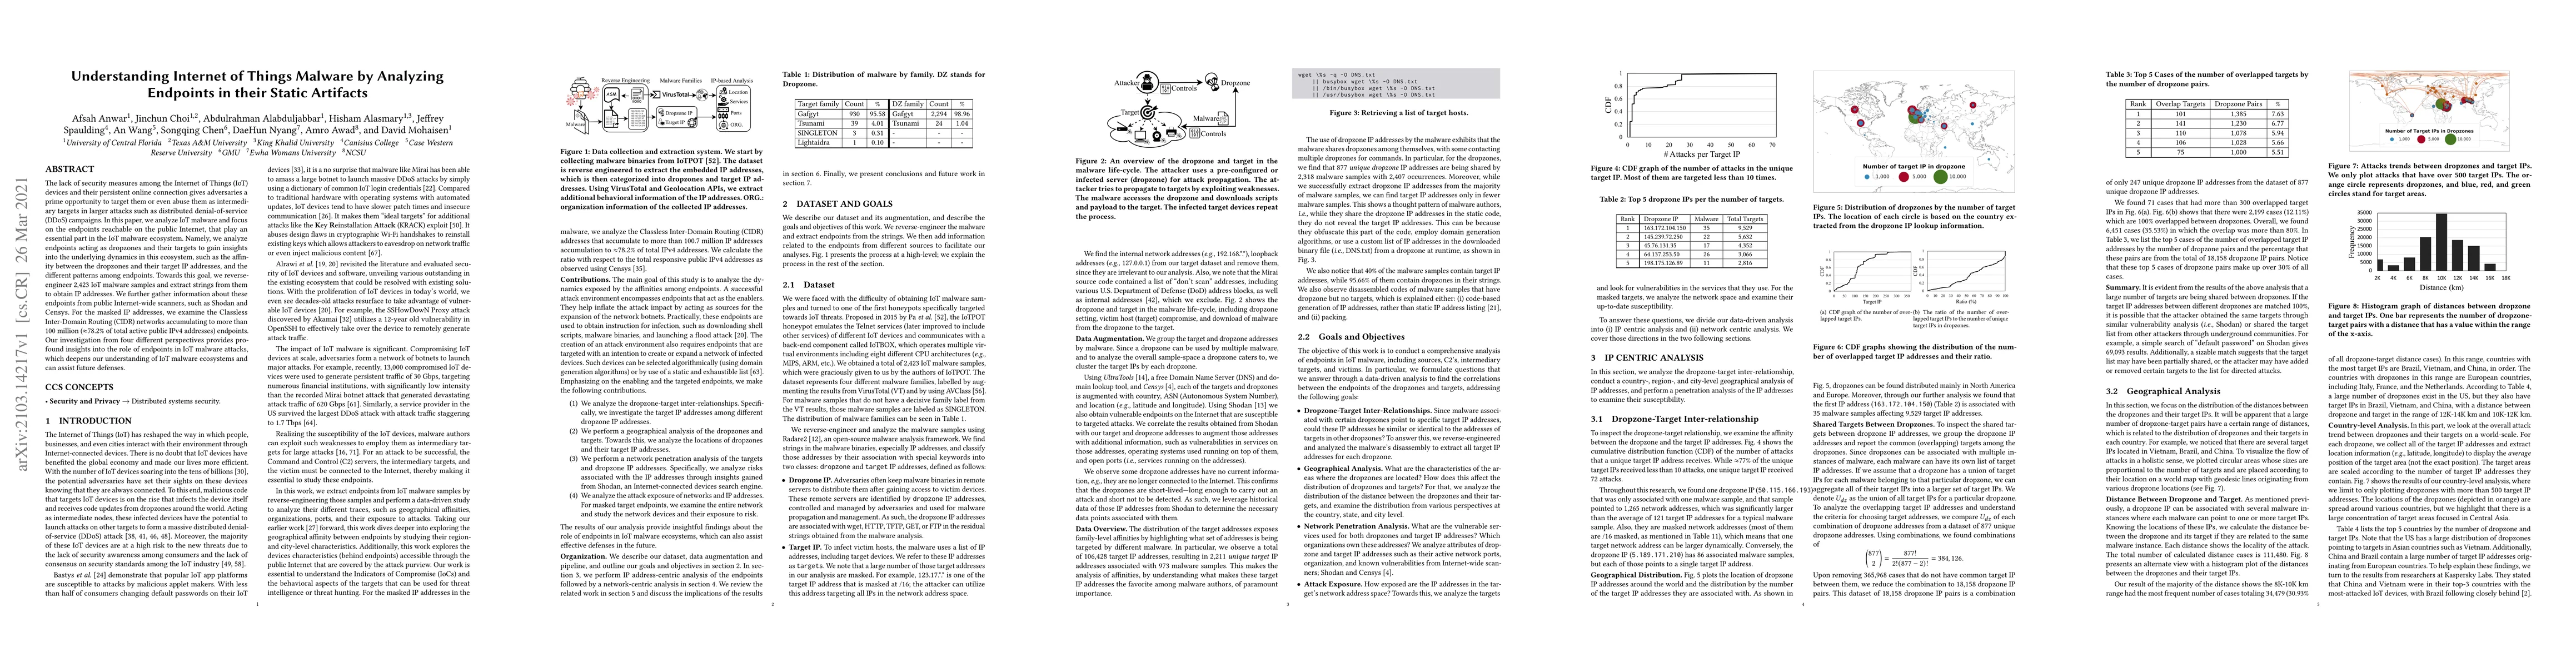
The lack of security measures among the Internet of Things (IoT) devices and their persistent online connection gives adversaries a prime opportunity to target them or even abuse them as intermediary targets in larger attacks such as distributed denial-of-service (DDoS) campaigns. In this paper, we analyze IoT malware and focus on the endpoints reachable on the public Internet, that play an essential part in the IoT malware ecosystem. Namely, we analyze endpoints acting as dropzones and their targets to gain insights into the underlying dynamics in this ecosystem, such as the affinity between the dropzones and their target IP addresses, and the different patterns among endpoints. Towards this goal, we reverse-engineer 2,423 IoT malware samples and extract strings from them to obtain IP addresses. We further gather information about these endpoints from public Internet-wide scanners, such as Shodan and Censys. For the masked IP addresses, we examine the Classless Inter-Domain Routing (CIDR) networks accumulating to more than 100 million (78.2% of total active public IPv4 addresses) endpoints. Our investigation from four different perspectives provides profound insights into the role of endpoints in IoT malware attacks, which deepens our understanding of IoT malware ecosystems and can assist future defenses.
AI Key Findings
Get AI-generated insights about this paper's methodology, results, significance, and more — seven facets brought into focus.
Impact
Paper Details
Authors
PDF Preview
Key Terms
Citation Network
Current paper (gray), citations (green), references (blue)
Display is limited for performance on very large graphs.
Discussion 0