Unsupervised Graph Spectral Feature Denoising for Crop Yield Prediction
Publication
Metrics
AI Quick Summary
This paper proposes an unsupervised method for denoised graph spectral feature extraction using graph signal processing to improve crop yield prediction at county level. It constructs a graph to encode spatial correlations and optimizes a weight parameter $\mu$ to balance fidelity and regularization, ultimately improving deep learning model performance.
Paper Preview
Abstract
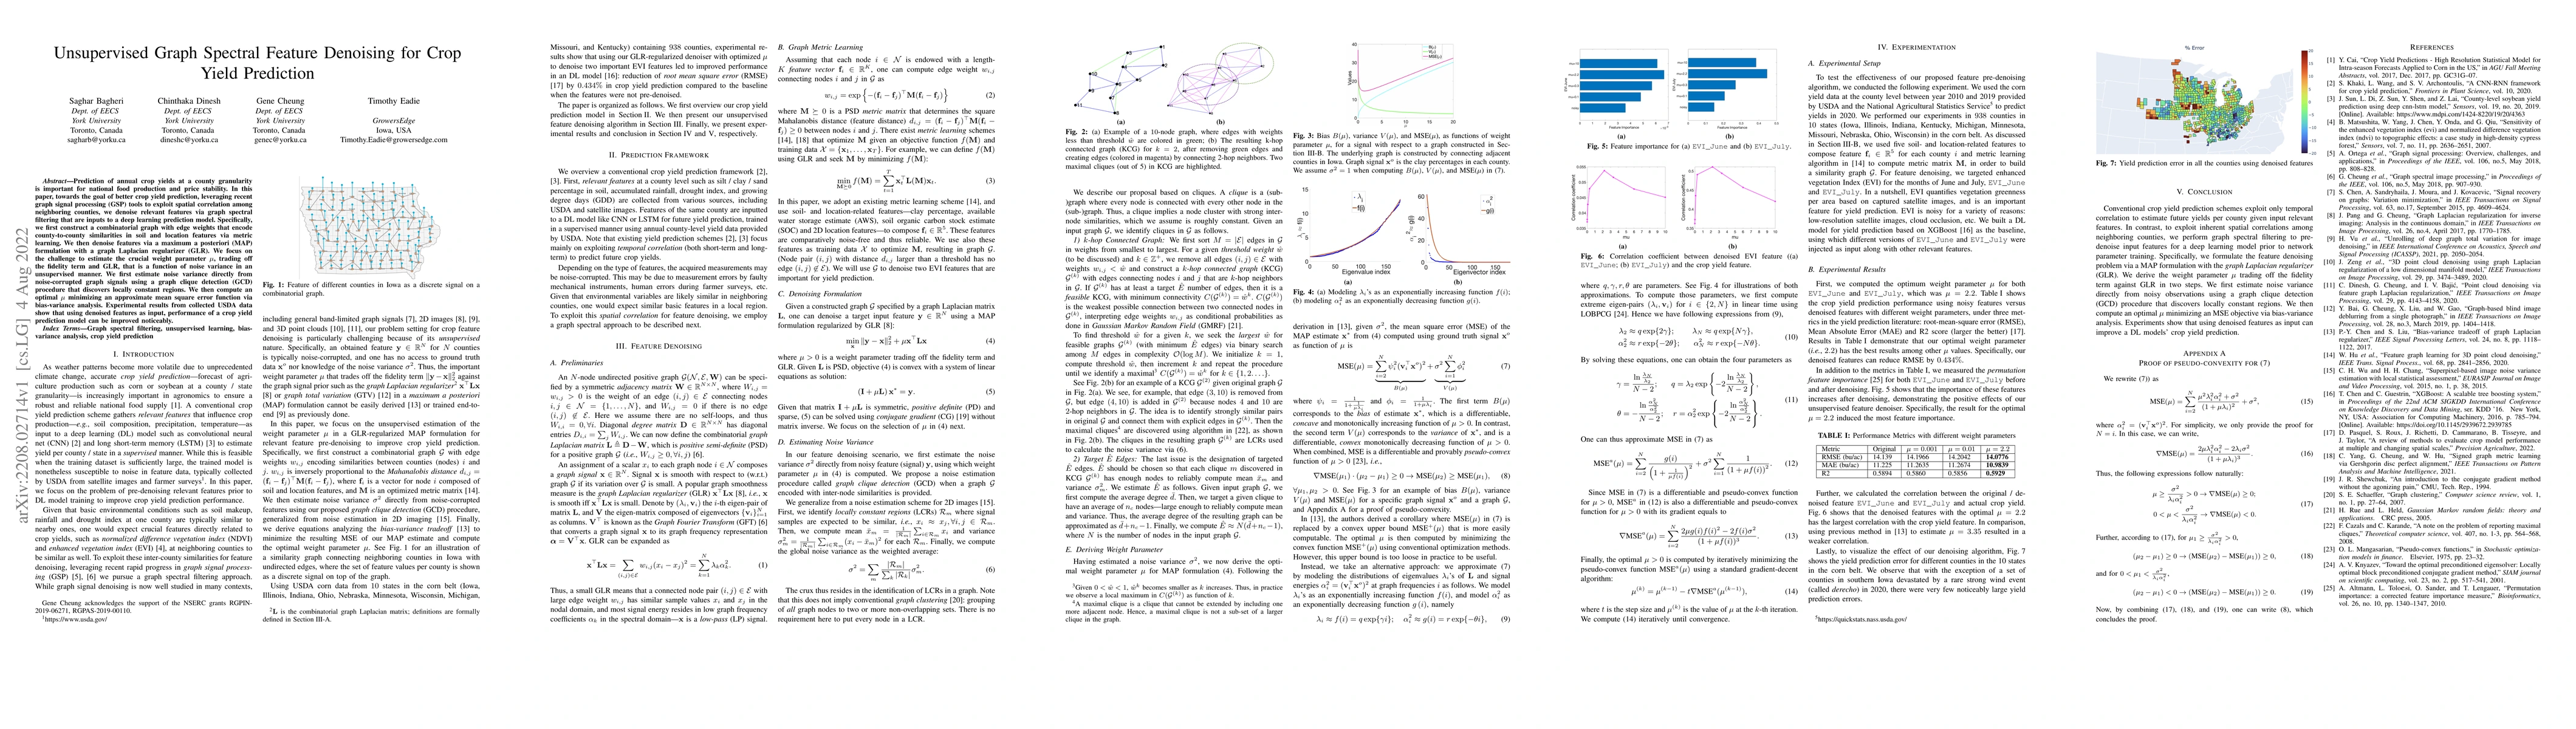
Prediction of annual crop yields at a county granularity is important for national food production and price stability. In this paper, towards the goal of better crop yield prediction, leveraging recent graph signal processing (GSP) tools to exploit spatial correlation among neighboring counties, we denoise relevant features via graph spectral filtering that are inputs to a deep learning prediction model. Specifically, we first construct a combinatorial graph with edge weights that encode county-to-county similarities in soil and location features via metric learning. We then denoise features via a maximum a posteriori (MAP) formulation with a graph Laplacian regularizer (GLR). We focus on the challenge to estimate the crucial weight parameter $\mu$, trading off the fidelity term and GLR, that is a function of noise variance in an unsupervised manner. We first estimate noise variance directly from noise-corrupted graph signals using a graph clique detection (GCD) procedure that discovers locally constant regions. We then compute an optimal $\mu$ minimizing an approximate mean square error function via bias-variance analysis. Experimental results from collected USDA data show that using denoised features as input, performance of a crop yield prediction model can be improved noticeably.
AI Key Findings
Get AI-generated insights about this paper's methodology, results, significance, and more — seven facets brought into focus.
Impact
Paper Details
Authors
PDF Preview
Key Terms
Citation Network
Current paper (gray), citations (green), references (blue)
Display is limited for performance on very large graphs.
Discussion 0